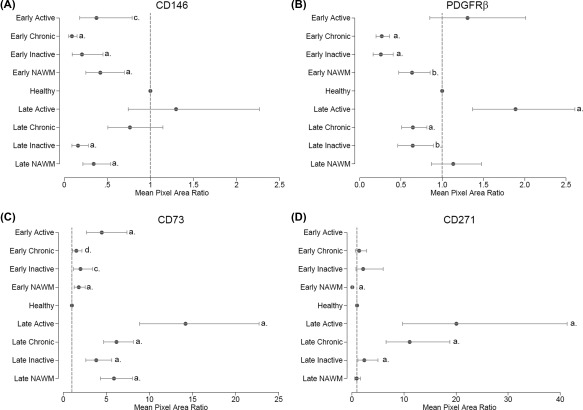
Figure 4.

Quantification of mesenchymal perivascular cells localization by image analysis in early progressive MS (EPMS) and late stage progressive MS (LPMS). Quantification of immunohistochemical staining for mesenchymal stromal cells/pericyte markers using generalized estimating equations demonstrated significant changes in mean pixel area ratio (fold‐change) stained between different MS tissue types and healthy, and demyelinating disease and healthy. A significant difference in marker detection between EPMS and LPMS tissues was also apparent. (A): CD146, (B): PDGFRβ, (C): CD73, and (D): CD271. Detailed numbers pertaining to the significance can be found in Supporting Information Table 3. p values a = ≤.001, b = ≤.005, c = ≤.01, and d = ≤ .05. The dotted line indicates the normalized value (1) of healthy tissue. Abbreviations: NAWM, normal‐appearing white matter; PDGFRβ, platelet‐derived growth factor receptor beta.
