
Figure 3.
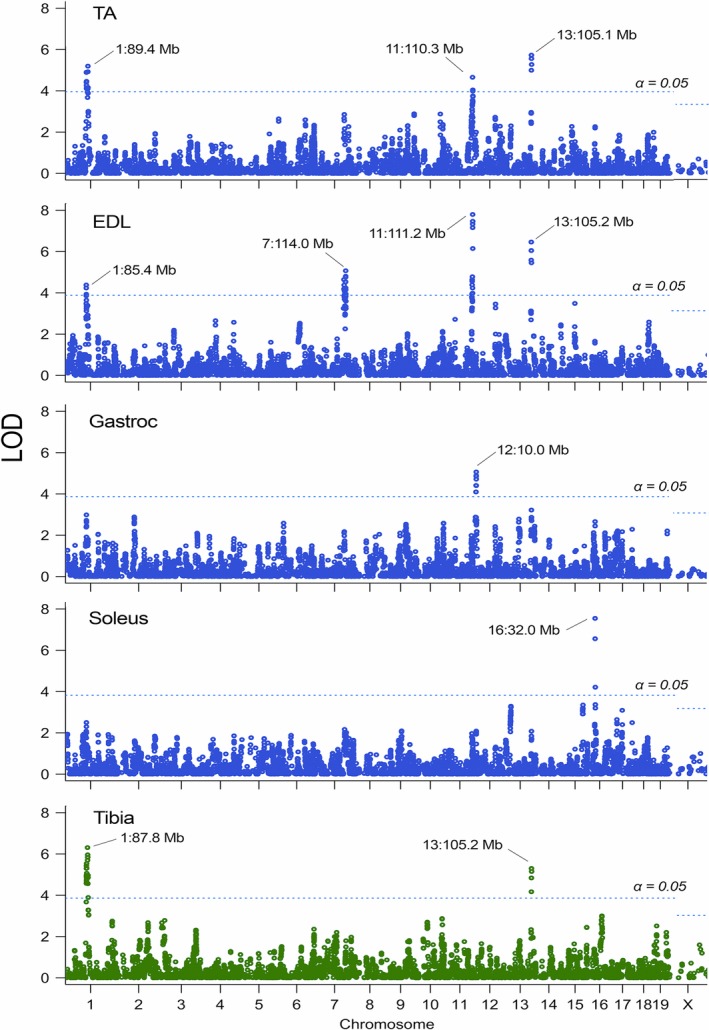
Genome‐wide scans for TA, EDL, gastrocnemius and soleus muscle weight (blue), and Tibia length (green). The vertical axes show the GEMMA LOD scores for the 7236 polymorphic SNPs arranged by their chromosomal positions in the horizontal axis. The horizontal blue line represents threshold at α = 5%.