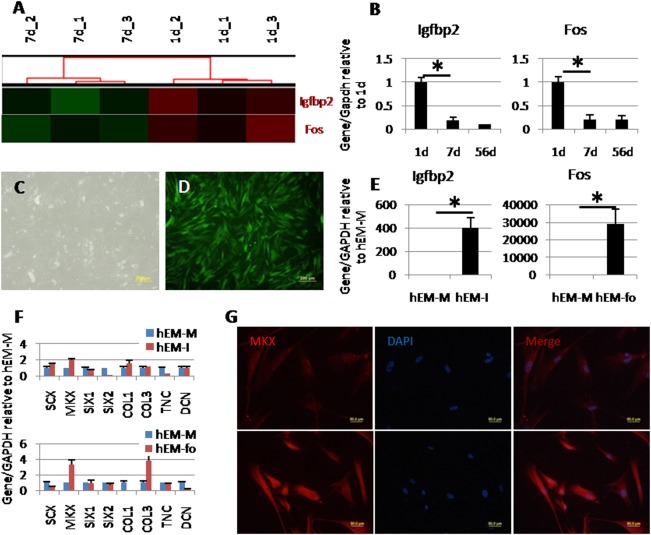
Figure 2.

Screen of early stage differentiation factors. (A): Gene cluster analysis of Igfbp2 and Fos. (B): qPCR results showing higher expression of Igfbp2 and Fos in 1d tendon tissue compared with 7d and 56d. (C, D): Overexpression in human embryonic stem cells derived mesenchymal stem cells (hESC‐MSCs). Green fluorescence indicating the transfection efficiency of green fluorescence protein (GFP) (control) came to nearly 100%. (E): Gene expression of Igfbp2 or Fos in overexpressed hESC‐MSCs. (F): Expression of tendon related genes in Igfbp2 or Fos overexpressed hESC‐MSCs, compared with GFP overexpressed hESC‐MSCs. (G): MKX immunofluorescence in control group (upper) and Fos overexpressed hESC‐MSCs (lower). Scale bars = 200 μm (C, D) and 50 μm (G). *Significant difference between two groups at p < .05. Abbreviations: hEM‐fo, Fos overexpressed in hESC‐MSCs; hEM‐M, control group with GFP overexpressed; hEM‐I, Igfbp2 overexpressed in hESC‐MSCs.
