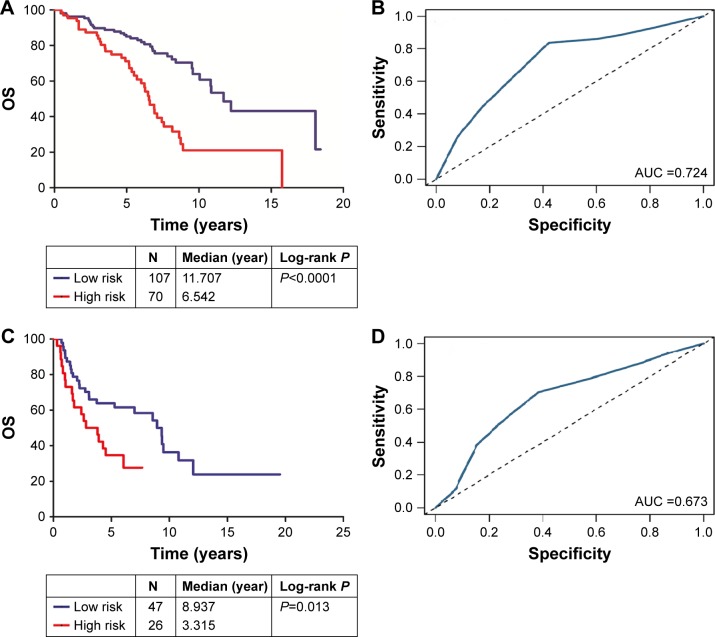
Figure 5.
(A) Kaplan–Meier analysis of OS in stage I and II groups: OS rates between the high-risk group and low-risk group showed statistically significant differences (P<0.0001); (B) the ROC curve AUC was 0.724. (C) Kaplan–Meier analysis of OS in stage III and IV groups: OS rates between the high-risk group and low-risk group showed statistically significant differences (P=0.0013); (D) the ROC curve AUC was 0.673. The performance of the signature was not associated with the AJCC stage of the patients.
Abbreviations: AJCC, American Joint Committee on Cancer; AUC, area under the curve; OS, overall survival; ROC, receiver operating characteristics.

