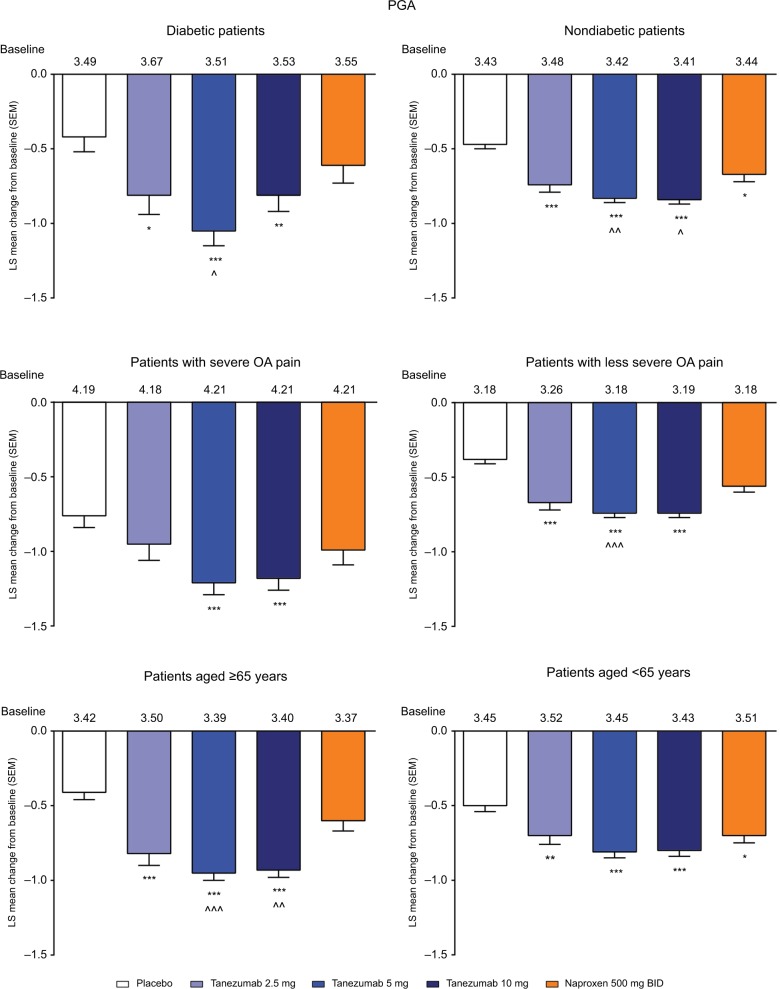
Figure 4.
Least squares mean change in PGA from baseline to week 16 for the subgroup analyses.
Notes: *P≤0.05; **P≤0.01; ***P≤0.001 vs placebo. ^P≤0.05; ^^P≤0.01; ^^^P≤0.001 vs naproxen.
Abbreviations: BID, twice daily; LS, least squares; OA, osteoarthritis; PGA, Patient’s Global Assessment; SEM, standard error of the mean; WOMAC, Western Ontario and McMaster Universities Osteoarthritis Index.

