. 2019 Jan 16;10(3):399–412. doi: 10.1039/c8md00582f

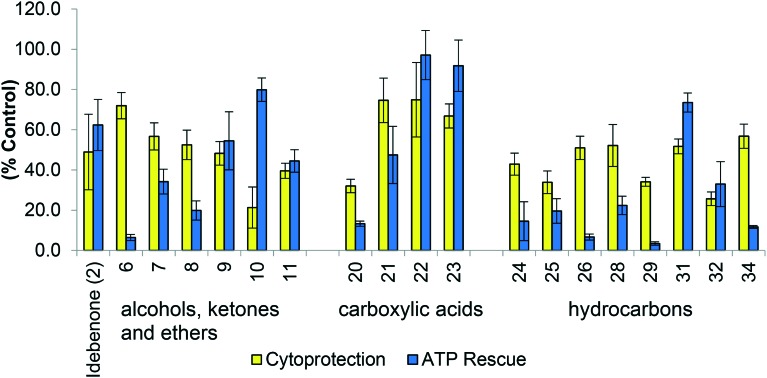
Fig. 6. Biological evaluation of polar, aliphatic and acid derivatives in two assays (i) Cytoprotection against rotenone induced complex I dysfunction by quinones at 10 μM given as a relative percentage of cell survival compared to untreated HepG2 cells (ii) ATP rescue by quinones at 10 μM in the presence of rotenone-induced complex I dysfunction as percentage of untreated HepG2 cells. Data represents the mean of n = 3 independent experiments with 6 replicates each. Note: Analogues had to provide at least 30% of normal function in either assay to be included in the above figure. Aliphatic esters 12–17 are not present in this graph as they showed minimal activity in both assays.

Fig. 6