
Figure 4: Comparisons of model predictions of HDX-MS data for each RGS protein.
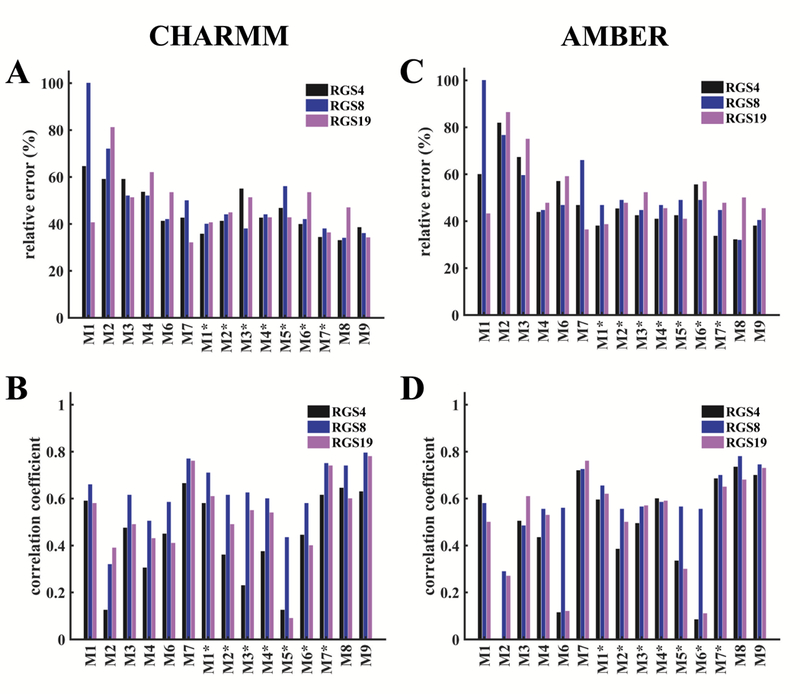
The definitions of E and CC, and other details are the same as in Figure 3. Colored bars distinguish data for each RGS protein: black bars, RGS4; blue bars, RGS8; and magenta bars, RGS19.