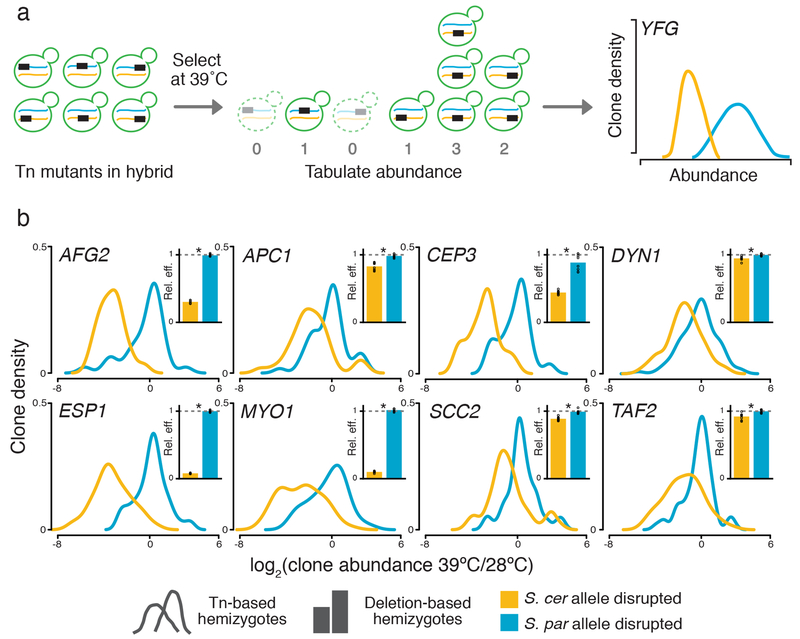
Figure 2. Mapping thermotolerance by RH-seq.
a, A transposon (Tn, rectangle) disrupts the allele from S. cerevisiae (blue) or S. paradoxus (orange) of a gene (YFG) in an interspecific hybrid (green). Clones lacking the pro-thermotolerance allele grow poorly at 39°C (dashed outlines), as measured by sequencing and reported in smoothed histograms (traces, colored to indicate the species’ allele that is not disrupted). b, Each panel reports results from one RH-seq hit locus. In the main figure of a given panel, the x-axis reports the log2 of abundance, measured by RH-seq after selection at 39°C, of a clone harboring a transposon insertion in the indicated species’ allele, relative to the analogous quantity for that clone from selection at 28°C. The y-axis reports the proportion of all clones bearing insertions in the indicated allele that exhibited the abundance ratio on the x, as a kernel density estimate. In insets, each bar reports the relative efficiency, calculated as the mean growth efficiency at 39°C (n = 8-12 cultures) of the indicated targeted-deletion hemizygote measured in liquid culture assays, normalized to the analogous quantity for the wild-type hybrid. *, p ≤ 0.002, two-sample, one-tailed t-test; individual measurements are reported as circles. See Supplementary Table 1 for exact p-values and sample numbers.

