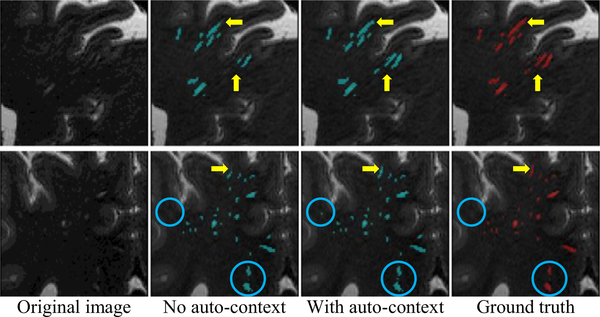
Fig. 10.
Illustration of segmentations obtained by the proposed M 2 EDN with or without auto-context information. The yellow arrows and the blue circles indicate, respectively, the refined PVS annotations and additional false positives, both due to the use of auto-context strategy. (For interpretation of the references to color in this figure legend, the reader is referred to the web version of this article.)

