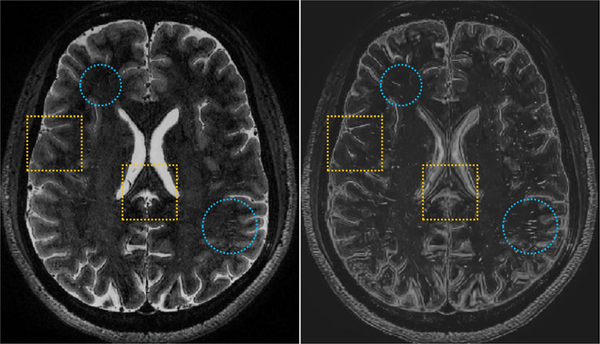
Fig. 3.
An example of the original T2-weighted MR image (at the left-panel) and the processed image (at the right-panel) shown in the axial view. The blue circles present the effectively enhanced tubular structures via the method proposed in Hou et al. (2017), while the yellow boxes show the lost image information, due to the enhancement and denoising procedures. (For interpretation of the references to color in this figure legend, the reader is referred to the web version of this article.)

