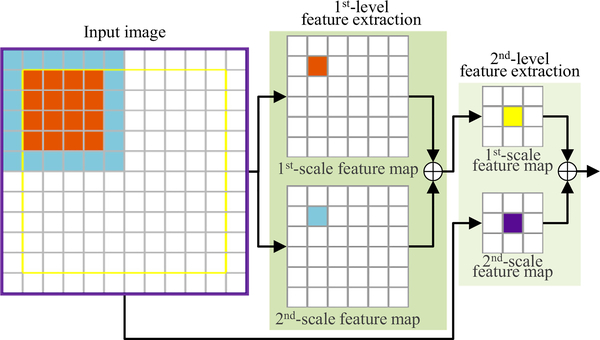
Fig. 4.
An illustration of multi-scale feature learning for a 2D input image (with the size of 12 × 12) in the proposed encoder sub-network. For the 1st-level feature extraction, the orange pixel in the 1st-scale feature map (top) and the blue pixel in the 2nd-scale feature map (bottom) correspond to the 4 × 4 orange region and the 6 × 6 blue region in the input image, respectively. Similarly, for the 2nd-level feature extraction, the yellow and purple pixels in the 1st- and 2nd-scale feature maps correspond to the 10 × 10 yellow region and the 12 × 12 purple region in the input image, respectively. That is, at each feature extraction stage, two complementarily feature maps are extracted from the identical center regions to characterize the input in both a fine scale (i.e., 4 × 4) and a coarse scale (i.e., 6 × 6). (For interpretation of the references to color in this figure legend, the reader is referred to the web version of this article.)

