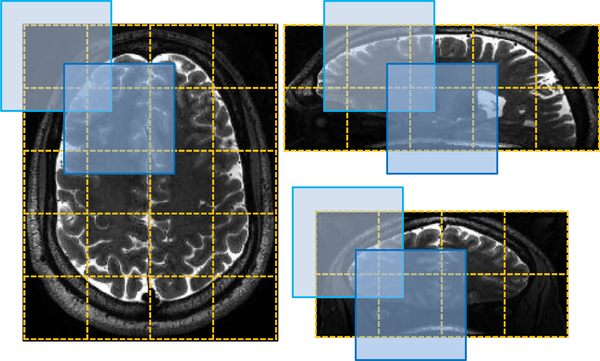
Fig. 5.
A 2D illustration from three different views to describe the procedure of generating the testing sub-images. The input image is divided into multiple blue blocks that are overlapped with each other. After prediction, only their central chunks with yellow dotted boundaries are padded together as the final segmentation of the input image. (For interpretation of the references to color in this figure legend, the reader is referred to the web version of this article.)

