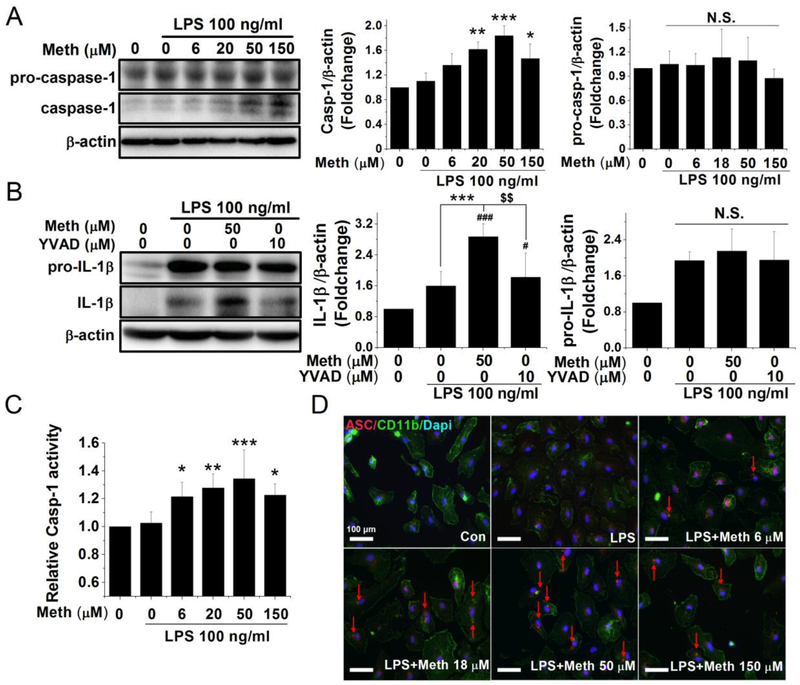
Fig. 3.
Meth treatment induced inflammasome activation in a dose-dependent manner. The cleavage and activation of caspase-1 were measured by western blot and quantified by colorimetric assay. The cultured microglia were primed with LPS 100 ng/ml for 6 h and treated with different concentrations of Meth for another 12 h. To evaluate the magnitude difference of the precursor and cleavage form of caspase-1, the densitometry of 45 kD pro-caspase-1 and 10 kD caspase-1 were quantified separately, which are shown in associated bar graphs (A). The enzyme activity of caspase-1 after incubation of Meth was measured by caspase-1 colorimetric assay (C). After 6 h priming of LPS, the caspase-1 inhibitor Ac-YVAD-cmk (10 μM) was applied 1 h before Meth treatment and the processing of IL-1β was measured after another 12 h of Meth (50 μM) treatment (B). As another indicator of inflammasome activation, the change of distribution of ASC protein was visualized by immunofluorescent microscope (D). The formation of ASC oligomers was detected in the cytoplasm and marked by red arrows (D). Blue: DAPI; Green: CD11b; Red: ASC. * p < .05, ** p < .01, *** p < .001 vs LPS. # p < .05, ### p < .001 vs Ctrl. $ $ p < .01 vs LPS + Meth 50 μM. Scale bar, 100 μm.

