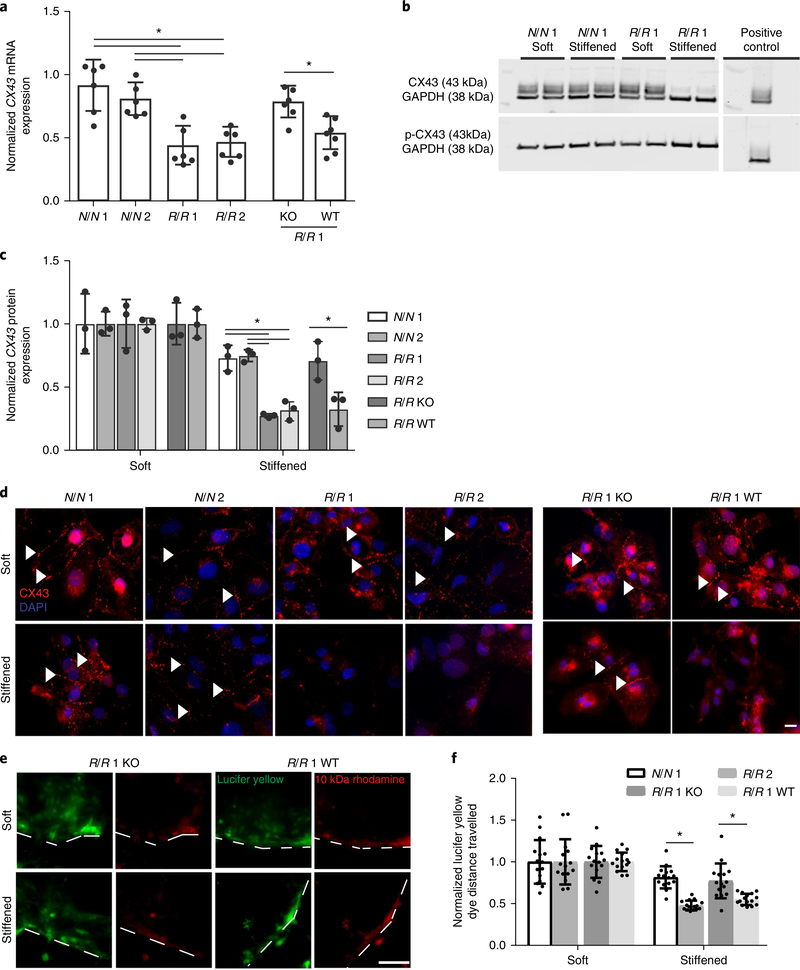
Fig. 3 |. Gap junction remodelling in R/R iPS cell-derived cardiomyocytes after dynamic stiffening.
a, Expression of connexin-43 mRNA (CX43 also known as GJA1). Values for stiffened substrates were normalized to those of soft substrates. *P = 0.002 for N/N 1 versus R/R 1 and *P = 0.004 for N/N 1 versus R/R 2, *P = 0.0027 for N/N 2 versus R/R 1 and *P = 0.0053 for N/N 2 versus R/R 2; one-way ANOVA followed by Tukey’s multiple comparison test. *P = 0.0054 for R/R 1 knockout versus R/R 1 wild-type; two-tailed Student’s t-test. N/N 1, n = 6 samples; N/N 2, n = 6 samples; R/R 1, n = 6 samples; R/R 2, n = 6 samples; R/R 1 knockout, n = 6 samples; R/R 1 wild-type, n = 7 samples. Data are mean ± s.d. with individual points. b, Blots showing phosphorylated and total connexin-43 expression for the indicated patient lines. c, Quantification of phosphorylated to total connexin-43. Values were normalized to GAPDH expression as a loading control (n = 3 blots). Human umbilical vein endothelial cells (HUVECs) were used as a positive control. *P = 0.002 for N/N 1 versus R/R 1 and *P = 0.003 for N/N 1 versus R/R 2, *P = 0.0015 for N/N 2 versus R/R 1 and *P = 0.003 for N/N 2 versus R/R 2; one-way ANOVA followed by Tukey’s multiple comparison test. *P = 0.032 for R/R 1 knockout versus R/R 1 wild-type; two-tailed Student’s t-test. Data are mean ± s.d. with individual points. d, Immunofluorescence images are shown for connexin-43 (red) and 4,6-diamidino-2-phenylindole (DAPI; blue) for the indicated iPS cell-derived cardiomyocyte patient types and bioreactor conditions. Arrowheads indicate regions of assembled connexin-43. Scale bar, 10 μm. Experiments were performed three independent times. e, Representative images demonstrating the transfer of lucifer yellow dye for the indicated iPS cell-derived cardiomyocyte patient types and bioreactor conditions. Rhodamine dextran images and dashed lines are included to indicate where the cut was made. Scale bar, 100 μm. Experiments were performed three independent times. f, Quantification of the distance the dye travelled (n = 15 cuts) was normalized to the distance travelled on soft substrates. *P = 0.0002 for N/N 1 versus R/R 1 and *P = 0.0011 for R/R 1 knockout versus R/R 1 wild-type; two-tailed Student’s t-test. Data are mean ± s.d. with individual points.

