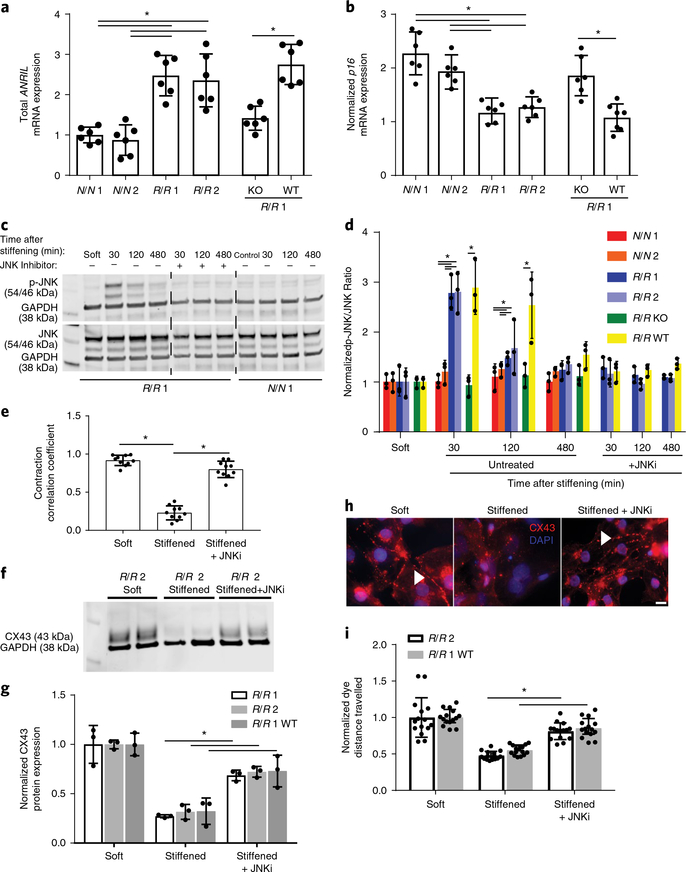
Fig. 4 |. JNK-mediated dysfunction in R/R cardiomyocytes in response to a stiffened hydrogel.
a, Expression levels of the mRNA transcrips of total ANRIL using primers directed against exons 5–6. Data are normalized to N/N patient 1. *P = 0.001 for N/N 1 versus R/R 1 and *P = 0.003 for N/N 1 versus R/R 2, *P = 0.0008 for N/N 2 versus R/R 1 and *P = 0.001 for N/N 2 versus R/R 2; one-way ANOVA followed by Tukey’s multiple comparison test. *P = 0.0004 for R/R 1 knockout versus R/R 1 wild-type; two-tailed Student’s t-test. n = 6 samples. Data are mean ± s.d. with individual points. b, Expression levels of p16 mRNA transcript for p16. Stiffened values were normalized to those for cells grown on soft substrates. *P = 0.001 for N/N 1 versus R/R 1 and *P = 0.001 for N/N 1 versus R/R 2, *P = 0.004 for N/N 2 versus R/R 1 and *P = 0.019 for N/N 2 versus R/R 2; one-way ANOVA followed by Tukey’s multiple comparison test. *P = 0.002 for R/R 1 knockout versus R/R 1 wild-type; two-tailed Student’s t-test. N/N 1, n = 6 samples; N/N 2, n = 6 samples; R/R 1, n = 6 samples; R/R 2, n = 6 samples; R/R 1 knockout, n = 6 samples; R/R 1 wild-type, n = 7 samples. Data are mean ± s.d. with individual points. c, Blots showing phosphorylated JNK and total JNK expression for the indicated patient line (bottom). Lanes are shown as indicated for the presence of the JNK inhibitor SP600125 and time course after stiffening. d, Quantification of the ratio of phosphorylated JNK to total JNK expression normalized to GAPDH. Values were normalized to GAPDH expression as a loading control (n = 3 blots). Comparisons between isogenic patient lines were intentionally separated from nonisogenic lines for the time course without inhibitor for clarity. *P = 0.0004 for N/N 1 versus R/R 1 and *P = 0.0004 for N/N 1 versus R/R 2, *P = 0.0009 for N/N 2 versus R/R 1 and *P = 0.0008 for N/N 2 versus R/R 2; one-way ANOVA followed by Tukey’s multiple comparison test at 30 min. *P = 0.0042 for R/R 1 knockout versus R/R 1 wild-type at 30 min; two-tailed Student’s t-test. *P = 0.0321 for N/N 1 versus R/R 1 and *P = 0.0283 for N/N 1 versus R/R 2, *P = 0.0417 for N/N 2 versus R/R 1 and *P = 0.0397 for N/N 2 versus R/R 2; one-way ANOVA followed by Tukey’s multiple comparison test at 120 min. *P = 0.026 for R/R 1 knockout versus R/R 1 wild-type at 120 min; two-tailed Student’s t-test. Mean ± s.d. with individual points. e, Contraction correlation coefficients for R/R cardiomyocytes on soft substrates, stiffened substrates and stiffened substrates treated with the JNK inhibitor (JNKi) SP600125 were plotted (n = 10 videos). *P < 0.0001 for soft versus stiffened and *P = 0.0006 for stiffened versus stiffened treated with JNKi; one-way ANOVA followed by Tukey’s multiple comparison test. Data are mean ± s.d. with individual points. f, Blots showing phosphorylated and total connexin-43 expression for the indicated patient line. g, Quantification of the ratio of phosphorylated connexin-43 to total connexin-43 expression normalized to GAPDH. Values were normalized to GAPDH expression as a loading control (n = 3 blots). *P = 0.0033 for R/R 1 stiffened versus stiffened treated with JNKi, *P = 0.0024 for R/R 2 stiffened versus stiffened treated with JNKi, *P = 0.029 for R/R 1 wild-type stiffened versus stiffened treated with JNKi; two-tailed Student’s t-test. Data are mean ± s.d. with individual points. h, Immunoflurorescence images of connexin-43 (red) and DAPI (blue) for the conditions described above. Scale bar, 10 μm. Experiments were performed three independent times. i, Quantification of the distance the dye travelled (n = 15 cuts). *P < 0.0001 for R/R 2 stiffened versus stiffened treated with JNKi and *P < 0.0001 for R/R 1 wild-type stiffened versus stiffened treated with JNKi; two-tailed Student’s t-test. Data are mean ± s.d. with individual points.

