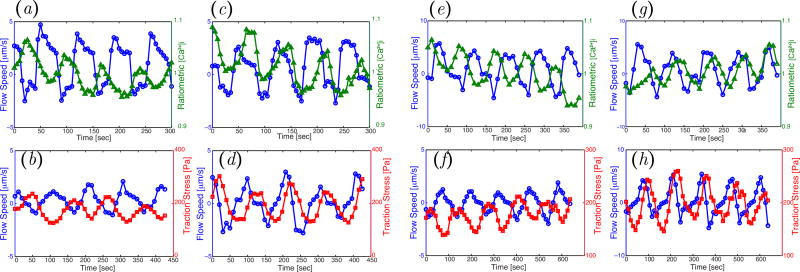
Figure 12.
Top row (a, c, e, g): Time histories of endoplasmic flow velocity (
 ) and ratiometric measurement of [Ca2+]i (
 ), averaged along the width of a peristaltic fragment (panels a and c) and an amphistaltic fragment (panels e and g). Bottom row (b, d, f, h): Time histories of endoplasmic flow velocity (
 ) and peripheral traction stress (
 ), averaged along the width of a peristaltic fragment (panels b and d) and an amphistaltic fragment (panels f and h). Panels (a, b, e, f): Fragment front. Panels (c, d, g, h): Fragment rear.

