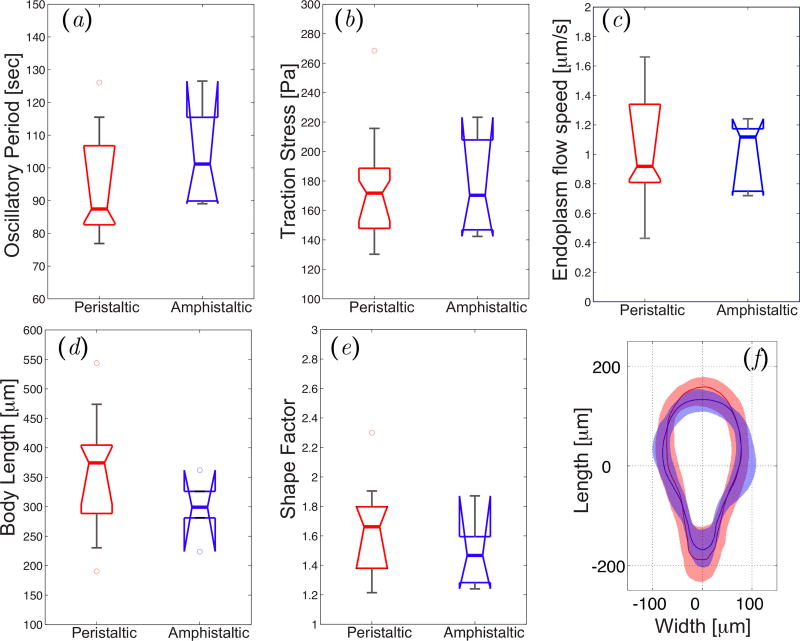
Figure 4.
(a)–(e) Box plots of motility parameters corresponding to peristaltic (N = 20) and amphistaltic (N = 8) Physarum fragments. (a) Average oscillation period. (b) Average magnitude of the traction stresses. (c) Average endoplasmic flow speed. (d) Average fragment length. (e) Shape factor. (f) Average shape of peristaltic (red line) and amphistaltic (blue line) types. Shaded regions contain 90% of the statistical distribution of shapes for each fragment type.

