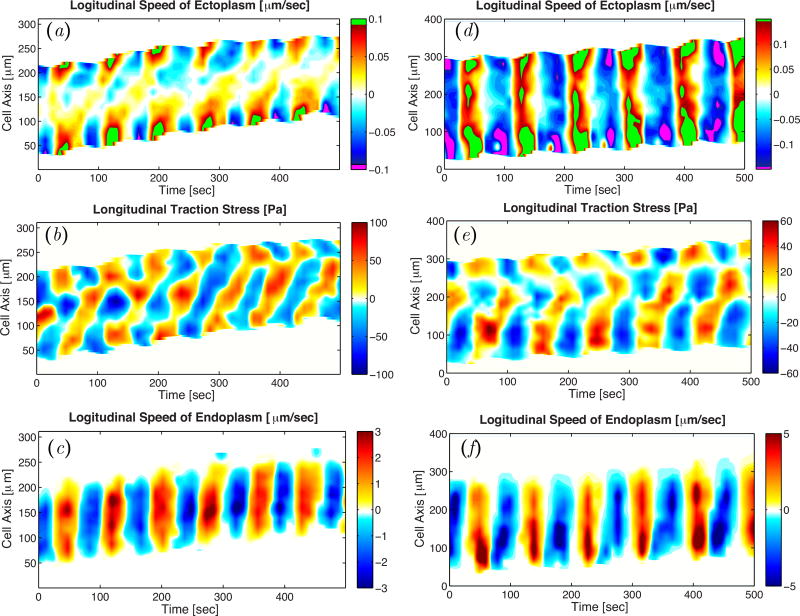
Figure 7.
Kymographs of longitudinal ectoplasm flow velocity (a, d), longitudinal traction stress (b, e), and longitudinal endoplasm flow velocity (c, f) for a peristaltic (a–c) and an amphistaltic (d–f) Physarum fragment. In panels (a, d), we have added bright green and purple at the floor and ceiling of the colormaps to emphasize asymmetries in the velocity data.

