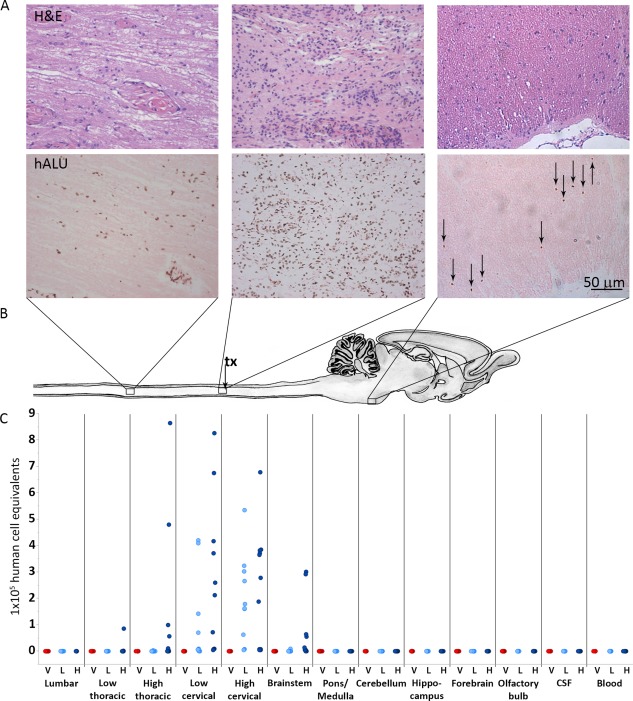
Figure 3.

AST‐OPC1 administration into the injured cervical spinal cord results in biodistribution that is limited to the spinal cord and brainstem. (A): Representative photomicrographs from rats treated with high dose AST‐OPC1 and assessed histologically at 9 months post‐treatment. The top panels in Figure 3A show representative H&E staining, and the bottom panels of Figure 3A show representative hALU staining of the most caudal distribution of cells positive for hALU (T1‐T2 thoracic spinal cord, left panels), the highest density of hALU positive cells observed within the cervical injury/AST‐OPC1 transplant site (middle panels), and the most rostral distribution of hALU positive cells (brainstem, caudal to pontine nucleus, right panels) observed with high dose AST‐OPC1 treatment. (B): Schematic of rat spinal cord and brain indicating regions of representative photomicrographs shown in (A) and aligned with biodistribution dot plot shown in (C). The cervical injury/AST‐OPC1 transplant site is indicated (tx, black arrow). (C): Dot plot of AST‐OPC1 biodistribution at 6 months post‐administration into the injured cervical spinal cord as determined by quantitative real‐time PCR for hALU. Consistent with the histology shown in (A), quantitation of hALU by PCR indicated the highest density of human cells in the cervical spinal cord, and the most rostral and caudal migration of human cells extending to the brainstem and thoracic spinal cord (high dose AST‐OPC1 only), respectively. Abbreviations: CSF, cerebral spinal fluid; H, high dose AST‐OPC1 (2.4 × 10⁶ cells per rat); hALU, human ALU; H&E, hematoxylin and eosin; L, low dose AST‐OPC1 (2.4 × 10⁵ cells per rat); V, vehicle.
