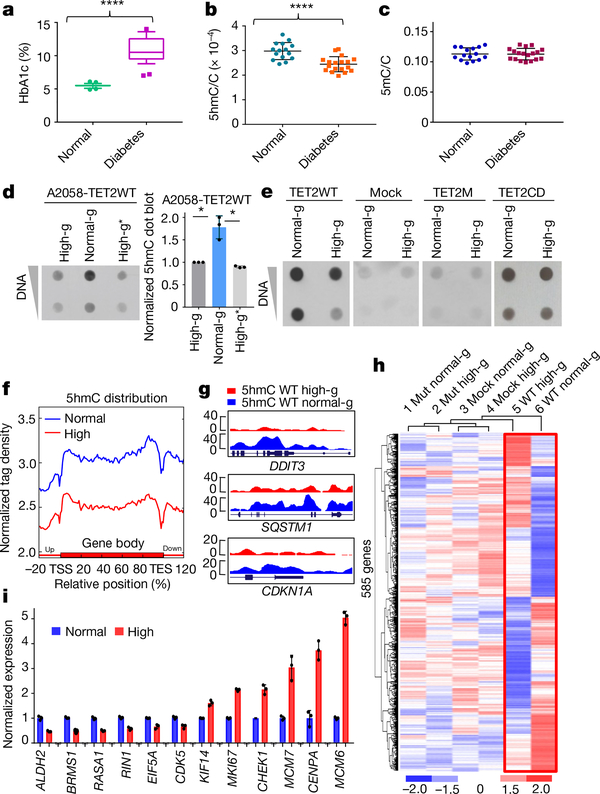
Fig. 1 |. Hyperglycaemia deregulates global DNA 5hmC levels, and this regulation requires a functional, full-length TET2.
a, Comparison of HbA1c between 28 healthy donors and 29 patients with diabetes. ****P = 2.88 × 10⁻¹⁵. Box plot: centre lines, median; limits, upper and lower quartiles; top and bottom whiskers, 10% and 90% percentiles; points, outliers. b, High-performance liquid chromatography with tandem mass spectrometry (HPLC–MS/MS) analysis of ratio of 5hmC to total C in randomly selected gDNA from 15 healthy donors and 18 patients. ****P = 7.44 × 10⁻⁵. c, HPLC–MS/MS analysis of ratio of 5mC to total C from the same samples as in b. d, Left, dot blot of 5hmC in DNA extracted from A2058-TET2WT cell line cultured in high glucose (high-g) or normal glucose (normal-g), or switched from normal to high glucose (high-g*). Right, quantification of dot blots. *P = 0.034 (high-g), P = 0.026 (high-g*). e, Dot blot comparison of 5hmC levels in A2058-TET2WT, mock (an A2058 cell line stably expressing empty vector), A2058-TET2M, and A2058-TET2CD cell lines cultured in high and normal glucose. f, Normalized hMeDIP–seq 5hmC tag density distribution across gene bodies in A2058-TET2WT cells cultured in high glucose (red) or normal glucose (blue). Each gene body was normalized relative to position percentage within the gene. g, hMeDIP–seq results of representative genes in which 5hmC is increased across the gene body in normal glucose. y-axis represents 5hmC density. h, Unguided clustering of genes that are differentially expressed when TET2 is present (in red frame) and not differentially expressed when TET2 is absent. Mut, A2058-TET2M. i, RT–qPCR validation of a subset of cancer-associated genes identified in h. Data represent three technical repeats in i and three biologically independent repeats in d, e. Two-sided Student’s t-test, data shown as mean ± s.d., *P < 0.05, ****P < 0.0001.

