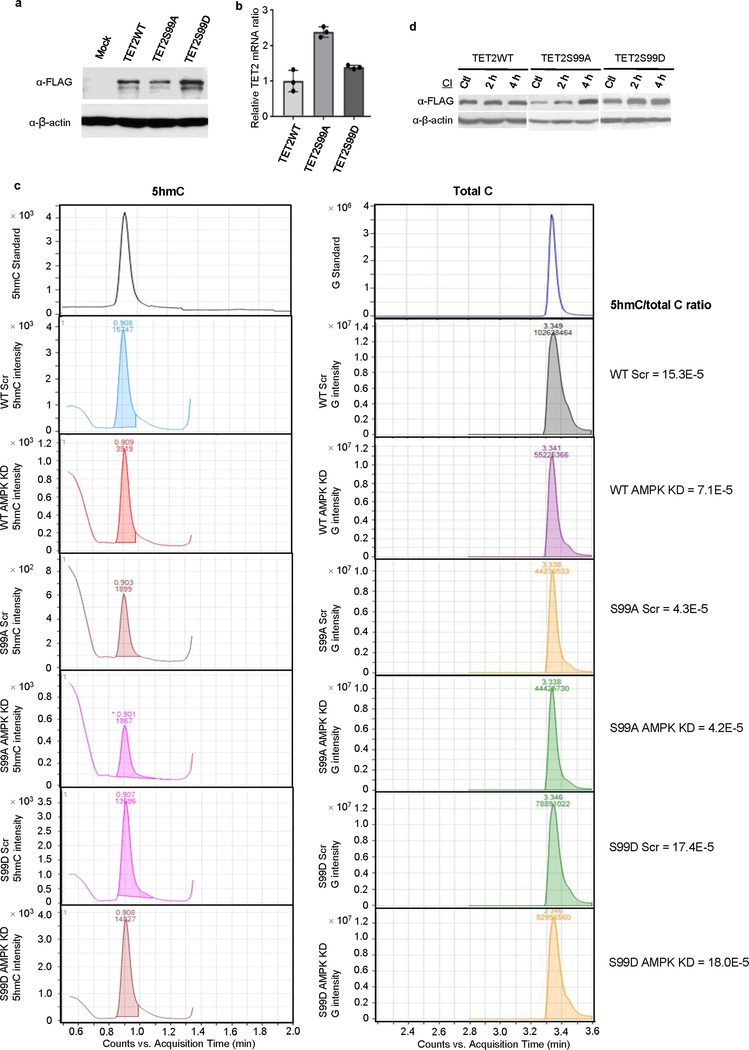
Extended Data Fig. 7 |. Effects of AMPK knockdown on 5hmC in cells expressing TET2WT, TET2S99A or TET2S99D.
a, b, Western blot (a) and RT–qPCR (b) to measure TET2 protein and mRNA levels in cells expressing TET2WT, TET2S99A or TET2S99D. TET2S99A has the lowest protein level (a), but it has the highest mRNA level (b) amongst the three cell lines. c, Representations of HPLC–MS/MS analysis of genomic DNA from A2058 cells expressing TET2WT, TET2S99A or TET2S99D with or without AMPK knockdown (AMPK KD) in Fig. 3i. Left, chromatograms of 5hmC in cells expressing TET2WT or mutants with or without AMPK KD. Right, corresponding chromatograms of G. Total cytosine levels were estimated and equalized to the intensities of G. The ratios (right) were calculated as 5hmC intensity/G intensity, which indicated the cellular 5-hydroxymethylation level. 5hmC levels in A2058 cells expressing TET2WT, but not TET2S99A or TET2S99D, were decreased after AMPK KD. d, Comparison of the rescuing effects of calpain inhibitor on TET2WT, TET2S99A and TET2S99D. Data are representative of three biologically independent repeats in a, b, d and three technical repeats in c. Data shown as mean ± s.d.

