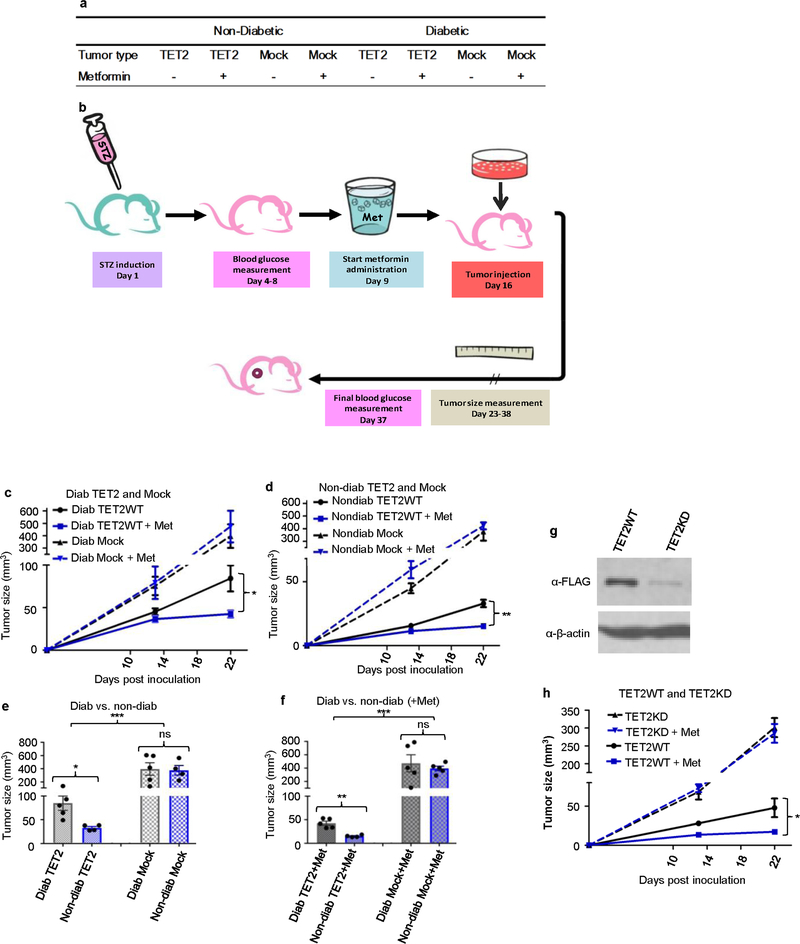
Extended Data Fig. 9 |. The mouse study paradigm and examination of the regulatory function of the tumour-suppressive glucose–AMPK–TET2 axis in vivo.
a, Division of mice into eight groups. b, Outline of experimental procedure. In brief, nude mice were first induced to develop diabetes, and then transplanted with designated tumour cells. Tumour formation and sizes were documented continuously for three weeks, followed by histological and pathological examination. See more details in Supplementary Information. c, d, Growth curves of A2058-TET2WT and A2058 mock tumours in diabetic (c) and non-diabetic (d) nude mice, with and without metformin treatment. n = 5, P = 0.048 in c; n = 4–5, P = 0.0046 in d. e, f, Comparison between endpoint A2058-TET2WT and mock tumour sizes in diabetic and non-diabetic mice. Mice were treated either with (f) or without (e) metformin, n = 4–5. Tumours from diabetic TET2 groups were significantly larger than that from nondiabetic TET2 groups in both e and f. However, mock groups showed no difference between diabetic or non-diabetic conditions in either e or f. *P = 0.026 (bottom), ***P = 0.00043 (top) in e; **P = 0.0023 (bottom), ***P = 0.00013 (top) in f. g, Western blot showed successful TET2 knock down (A2058-TET2KD cells) in comparison with its TET2WT precursor. Data are representative of three biologically independent repeats. h, Growth curves of A2058-TET2WT and A2058-TET2KD tumours with and without metformin treatment, n = 4–5. The curve indicates that A2058-TET2KD tumours were no longer suppressed by metformin, and grew larger than A2058-TET2WT tumours; *P = 0.031. Two-sided Student’s t-test, data shown as mean ± s.e.m. *P < 0.05, **P < 0.01, ***P < < 0.001, ****P < 0.0001; ns, not significant.

