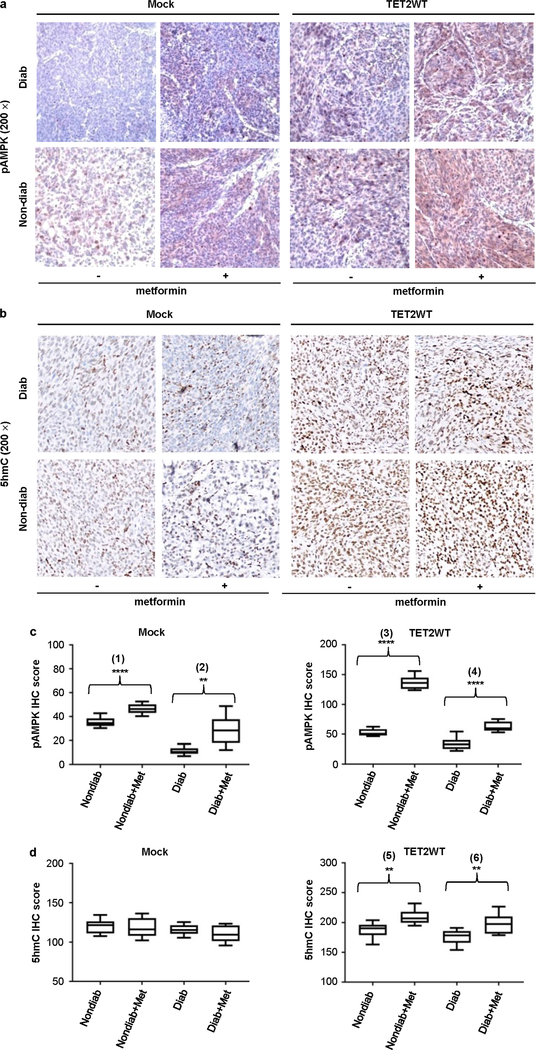
Extended Data Fig. 10 |. 5hmC and pAMPK levels in tumour xenografts after metformin treatment in diabetic and non-diabetic mice.
a, Representative histology of pAMPK IHC staining in mock and A2058-TET2WT tumours treated with (+) or without (−) metformin (200×); pictures represent four different stained slides in each group. b, Representative histology of 5hmC IHC staining in mock and A2058-TET2WT tumours treated with (+) or without (−) metformin (200×); pictures represent four different stained slides in each group. All slides were counterstained with haematoxylin (light blue). c, d, Statistical analyses of the average score of pAMPK and 5hmC staining in mock and A2058-TET2WT tumours treated with or without metformin. Counts were done on 10 random fields in each group. Metformin treatment increased pAMPK in both mock and A2058-TET2WT tumours xenografted into diabetic and non-diabetic mice; ***P = 6.06 × 10⁻⁶ (1), **P = 0.0013 (2), ****P = 1.04 × 10⁻¹¹ (3), ****P = 3.53 × 10⁻⁶ (4). However, metformin increased 5hmC only in A2058-TET2WT tumours in diabetic and non-diabetic mice, with no increase in 5hmC in mock tumours under metformin treatment; **P = 0.0010 (5), **P = 0.028 (6). Box plot: centre lines, median; limits, upper and lower quartiles; top and bottom whiskers, minima and maxima. Two-sided Student’s t-test, data shown as mean ± s.d. *P < 0.05, **P < 0.01, ***P < 0.001, ****P < 0.0001.

