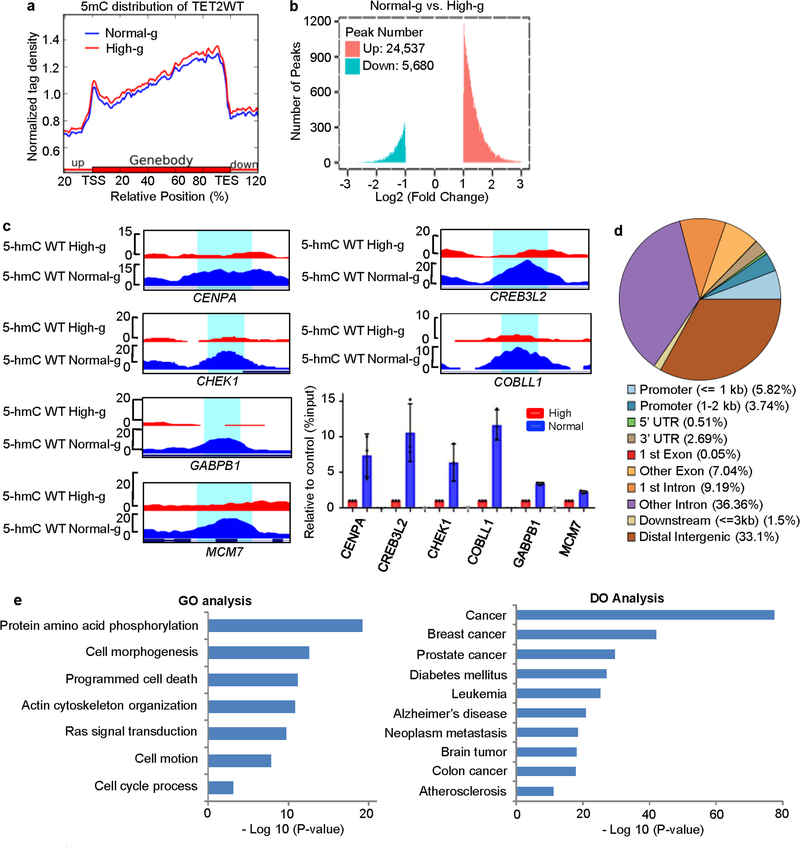
Extended Data Fig. 2 |. Genome-wide alterations in 5mC and 5hmC under normal glucose compared with high glucose.
a, Normalized 5mC tag density distribution of A2058-TET2WT across gene bodies under high glucose (red) and normal glucose (blue). Each gene body was normalized relative to position percentage within the gene. In contrast to 5hmC (Fig. 1f), the 5mC landscape of A2058-TET2WT cells showed marginal differences between high and normal glucose conditions. b, Total peak numbers for differentially 5-hydroxymethylated regions (DhMRs) when comparing normal glucose to high glucose. We identified 30,217 DhMRs in total, among which the majority (>80%, ~24,537) were increased in normal glucose, whereas <20% were decreased. c, hMeDIP–qPCR validation of DhMRs in a group of cancer-related genes including CHEK1, CENPA, MCM7, CREB3L2, GABPB1 and COBLL1 in A2058-TET2WT cells under high or normal glucose conditions; n = 3 biologically independent repeats. d, Genome-wide distribution of increased DhMRs in annotated genomic regions in A2058-TET2WT cells under normal glucose compared to high glucose. The majority of the DhMRs (65.4%) localized to transcribed gene regions, with 9.56% in promoters and 55.84% in gene bodies. e, Gene ontology (GO, left) and disease ontology (DO, right) analysis of genes (n = 11,475) that had increased DhMRs in A2058-TET2WT cells under normal glucose compared to high glucose. These genes were enriched in pathways related to cancer.

