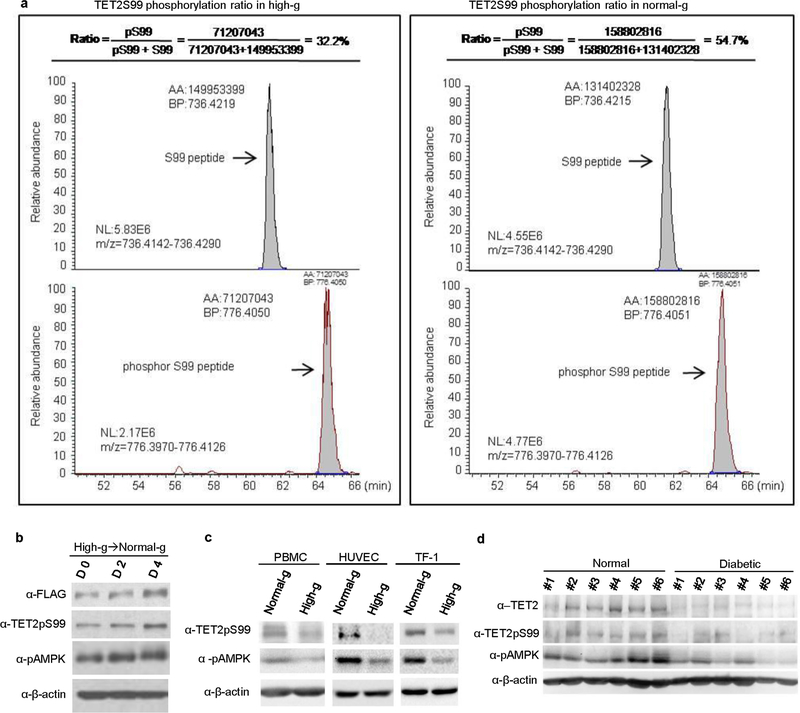
Extended Data Fig. 5 |. Increased AMPK activation, TET2 phosphorylation and TET2 stability in cells cultured with normal glucose.
a, Representations of TET2 S99 phosphorylation levels detected by LC–MS/MS in A2058-TET2WT cells cultured under high (left) or normal glucose (right). Flag–TET2 from A2058-TET2WT cells cultured under normal or high glucose was purified and then subjected to LC–MS/MS analysis. The peak areas represent the abundance of peptides that contained non-phosphorylated S99 (top) or phosphorylated S99 (bottom). The ratio was calculated as area(phosphorylated S99)/(area(phosphorylated S99) + area(non-phosphorylated S99)), which indicated the level of S99 phosphorylation. S99 phosphorylation (TET2pS99) in cells cultured in normal glucose was significantly higher than the phosphorylation levels observed in cells cultured under high glucose. Data are representative of three biologically independent repeats in each condition. b, A2058-TET2WT cells were switched from high to normal glucose for 0, 2 or 4 days. Results showed a steady increase in the levels of pAMPK as well as TET2pS99 and Flag–TET2 during this period. Data are representative of three biologically independent repeats. c, Western blot showing increased levels of TET2pS99 and pAMPK in cell lines (PBMC, HUVEC, TF-1) cultured under normal glucose versus high glucose. Data are representative of three biologically independent repeats. d, Western blot comparison of TET2, TET2pS99, and pAMPK levels between PBMCs from healthy donors and from patients with diabetes. TET2, TET2pS99 and pAMPK levels were significantly higher in healthy donors than in patients. Data are representative of three western blot repeats.

