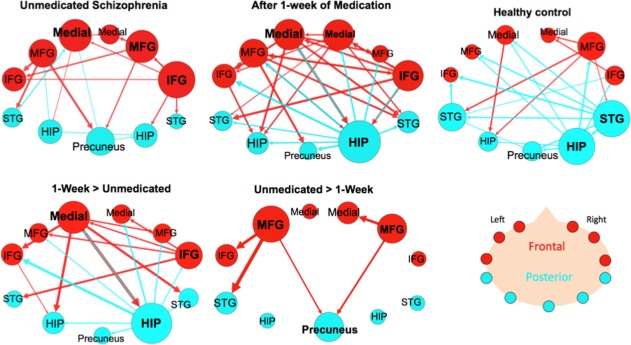
Figure 5.

Effective connectivity paths among the 11 regions measured within a sample of patients with schizophrenia (SZ; n = 16) before and after medication and Healthy Controls (HC; n = 16). The top row shows the withingroup results for SZ before and after medication and a matched HC subsample. The bottom row shows paths that were significantly greater in SZ after 1 week of medication compared to unmedicated SZ (Medicated SZ > Unmedicated SZ) and paths that were significantly greater before medication (Unmedicated SZ > Medicated SZ). Frontal brain regions are depicted in red and the posterior brain regions in blue. The size of the Region of Interest (ROI) circle and its label correspond to that region's degree (number of in and out paths). Paths with greater strength (t values) are depicted as having thicker lines‐ t value range 3.10–19.09. ROIs are arranged as if looking on top of head from above with left on left and right on right. Abbreviations: HIP, posterior hippocampus; IFG, inferior frontal gyrus; Medial, medial frontal gyrus; MFG, middle frontal gyrus; STG, superior temporal gyrus. [Color figure can be viewed in the online issue, which is available at http://wileyonlinelibrary.com.]
