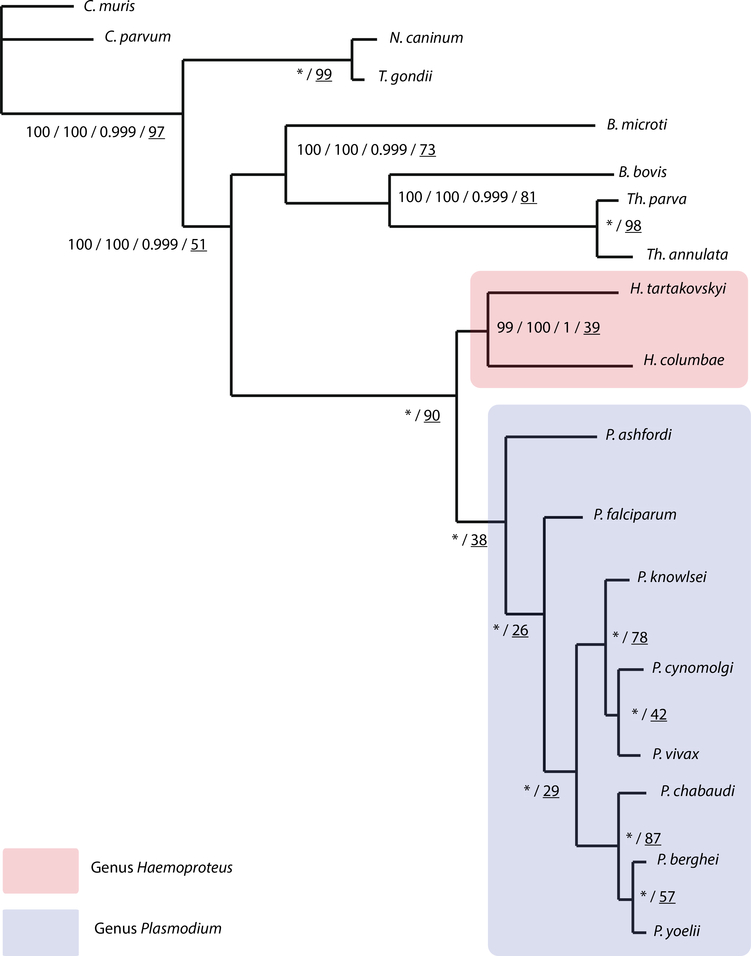
Fig. 2.
Composite phylogenetic tree of apicomplexans focusing on haemosporidian parasites. Tree includes bootstrap support values for maximum likelihood analyzed ungapped and gapped datasets, Bayesian posterior probability and single-gene tree support percentages, respectively (ML-ungapped/ML-gapped/Bayes/single-gene). * indicates 100% bootstrap support and posterior probability for all analysis. Underlined numbers indicate the percentage of single-gene trees supporting the node topology. Bootstrap values produced with RAxML and posterior probability values produced with MrBayes. The scale bar displays branch length in units of evolutionary distance

