
Figure 1.
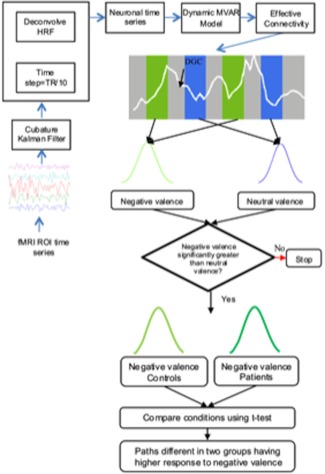
Schematic illustrating the directional connectivity analysis pipeline. The time series extracted from different ROIs were first deconvolved using a cubature Kalman filter without any assumptions about the shape of the underlying hemodynamic response. As this is a continuous time model, a time step of TR/10 was used to discretize it. The resulting latent neuronal variables were input into the dynamic multivariate autoregressive model to obtain time‐varying directional connectivity between the ROI time series. The connectivity values corresponding to negative and neural valence conditions were populated into different samples to find the paths which were greater during negative valence. Among these paths, the connectivity values for negative valence were compared across the two groups to determine those which differed between groups. [Color figure can be viewed in the online issue, which is available at http://wileyonlinelibrary.com.]