
Figure 4.
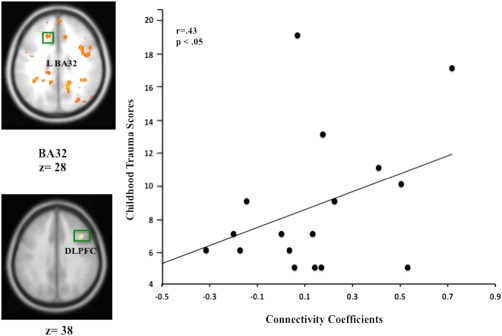
Scatter plot depicting the relationship between trauma history and mPFC‐DLPFC connectivity. Individual differences in the relationship between ELT history and mPFC‐DLPFC indicating a negative causal relationship between mesial and lateral PFC among non‐ELT exposed depressed but a positive causal relationship for ELT‐exposed depressed. N = 20, P < 0.05. Coordinates (BA 32; x = −10, y = 30, z = 28; and x = 41, y = 19, z = 38 Montreal Neurological Institute; MNI coordinate system). [Color figure can be viewed in the online issue, which is available at http://wileyonlinelibrary.com.]