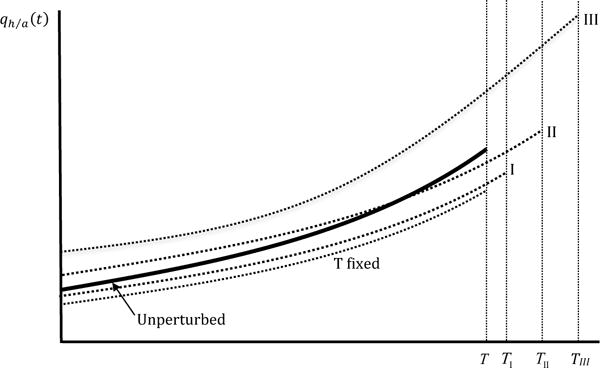
Figure 3.

Evolution of the relative marginal value of health qh/a(t) with age due to variation in H0. The solid thick line, labelled “Unperturbed”, represents the unperturbed path. The perturbed paths are shown for the T fixed case (dotted line, labelled “T fixed”), scenario I, associated with small life extension TI (dotted line, labelled “I”), scenario II, associated with intermediate life extension TII (dotted line labelled “II”), and scenario III, associated with large life extension (dotted line labelled “III”).
