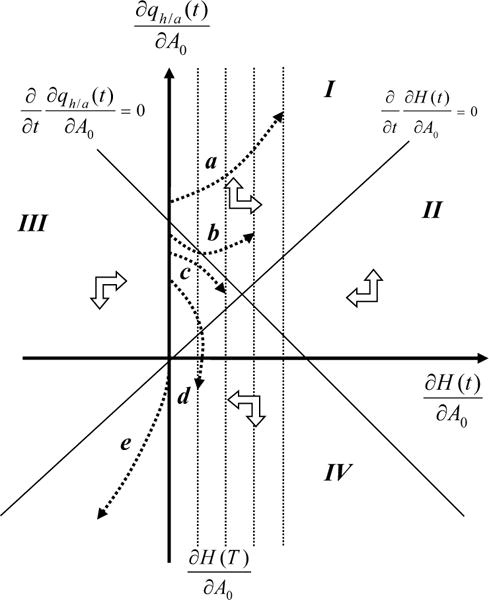
Figure 7.

Phase diagram of the deviation from the unperturbed path, resulting from variation in initial wealth δA0, of the relative marginal value of health ∂qh/a(t)/∂A0 and of the health stock ∂H(t)/∂A0, allowing length of life T to be optimally chosen. The four vertical dotted lines represent different potential values for the end point ∂H(T)/∂A0.
