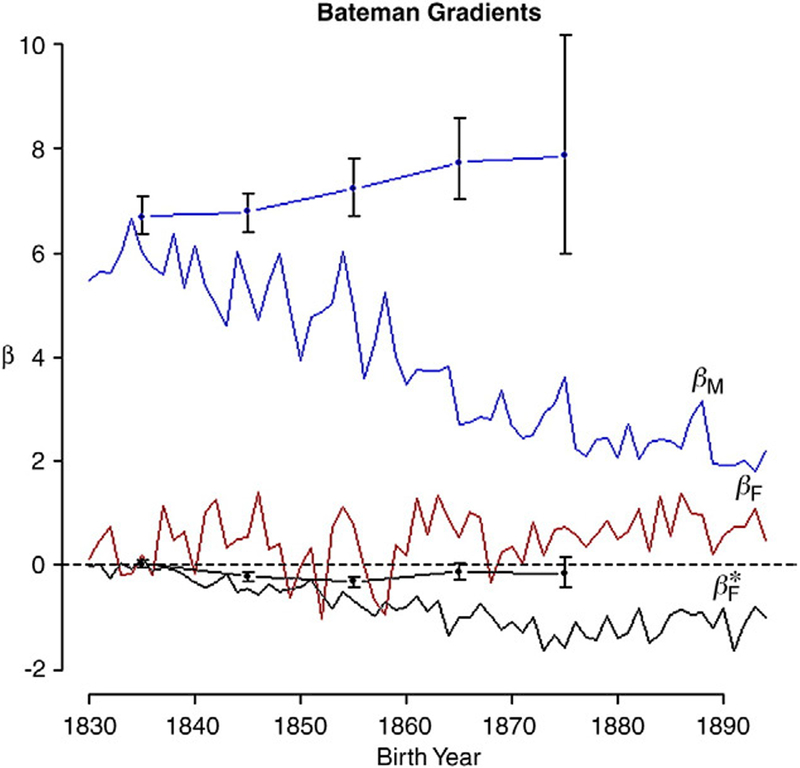
Fig. 4.
Bateman gradients by birth year (βM is blue, βF is red and βF* is black). Dotted lines and error bars correspond to estimated gradients when serial monogamists are excluded from the analysis. These are grouped by decade of birth. Of these, the upper (blue) line corresponds to βM and the lower black line to βF* Error bars represent the 95% confidence intervals estimated by bootstrapping over parents (using the adjusted bootstrap percentile method in R version 2.10.1 ‘boot’ package; Canty & Ripley, 2009; Davison & Hinkley, 1997; R Development Core Team, 2009) . In terms of fitness, polygyny strongly benefits males but weakly harms females.

