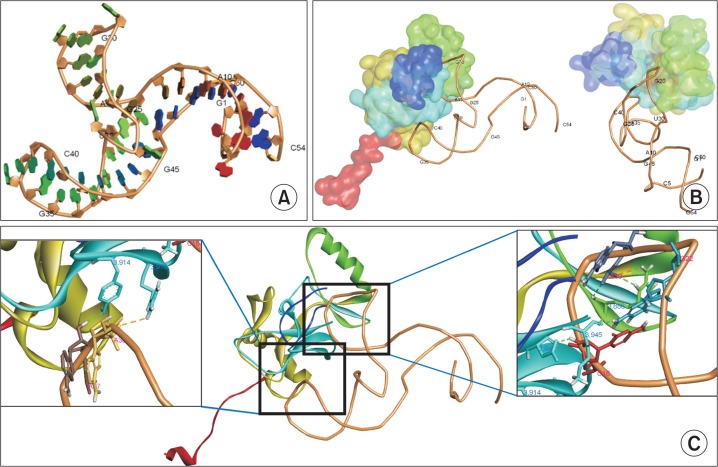
Fig. 7.
3D-structure predictions for APT1-MLL1 interactions. (A) Predicted 3D-structure of APT1 was constructed. The numbers represent the order of nucleotide residues. Some nucleotide residues are indicated. (B) 3D-structure of the complex was calculated using NPDock web server and illustrated in two different views. MLL1 SET domain is represented as subdomains with different colors such as the N-flanking region in red, SET-N in dark yellow, SET-I in green, SET-C in cyan, and post-SET in blue. (C) Hydrogen bonds formed between APT1 and MLL1 protein in two regions (dotted lines). The bases interacting with MLL1 amino acids are illustrated.

