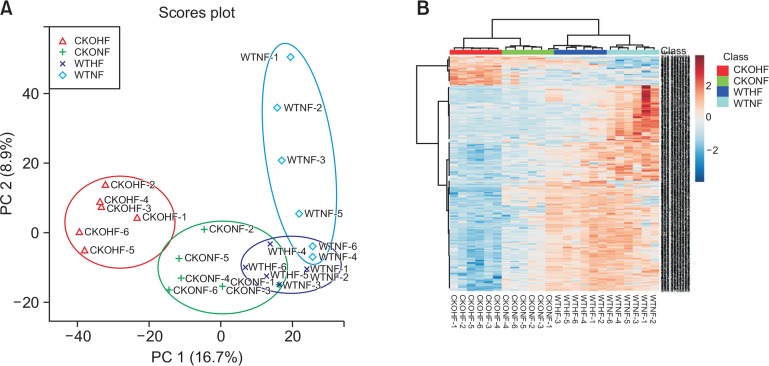
Fig. 2.
PCA and HCA based on discrimination of HFD or NFD fed WT and CKO mice. Fig. 2 shows the result of PCA (A) and HCA (B) (http://www.metaboanalyst.ca/). In Fig. 2A, each group showed a tendency to gather in their respective colored circle. Fig. 2B shows HCA a clear separation of clustering among all 4 groups (WTNF, WTHF, CKONF, and CKOHF) with color keys (upper clustering bar).

