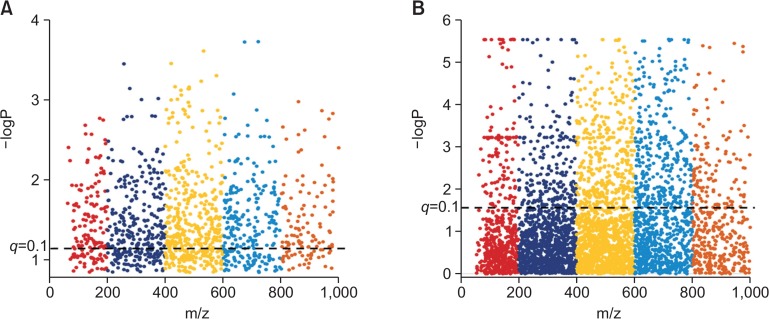
Fig. 3.
Manhattan plots of (A) WTNF vs WTHF and (B) WTHF vs CKOHF. Fig. 3 represents a Manhattan plot with the black dashed line corresponding to q=0.1. Dots above the dashed line represent 871 significant features (q<0.1) upon comparing WTNF and WTHF (A). Dots above the dashed line represent 1172 significant (q<0.1) upon comparing WTHF and CKOHF (B).

