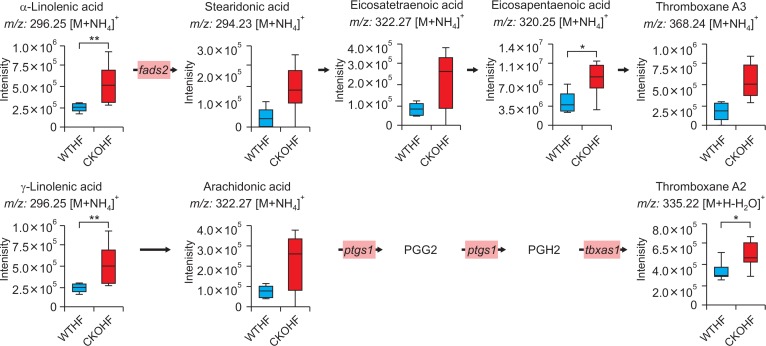
Fig. 8.
Linolenic acid metabolism pathway affected in CKOHF compared to WTHF. The bar graphs represent that α/γ-linolenic acid, eicosapentaenoic acid and thromboxane A2 were significantly different in CKOHF compared to WTHF (q<0.1). Gene expression of ptgs1 and tbxas1 in pink boxes were highly up-regulated (FC threshold=1.5) in CKOHF compared to WTHF. FADS2 was up-regulated but not within the criteria (FC threshold=1.5). Stearidonic acid, eicosatetraenoic acid, thromboxane A3 and arachidonic acid showed the tendency of increase in CKOHF compared to WTHF but not significant. m/z values of α-linolenic acid and arachidonic acid were identical to γ-linolenic acid and eicosatetraenoic acid, respectively. *q<0.05 **q<0.01.

