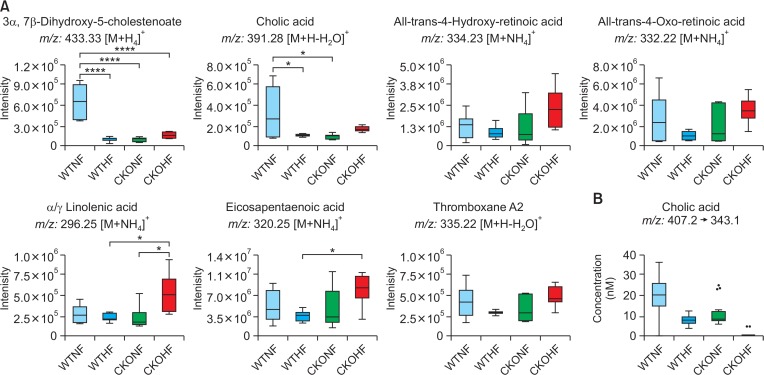
Fig. 9.
Overall observation of HFD and CKO effect on pathways. (A) This figure represents relative intensities of metabolites related to 3 pathways, primary bile acid biosynthesis, retinol metabolism, and linolenic acid metabolism, in all 4 groups in form of box and whisker plot. Two metabolites from primary bile acid biosynthesis are decreased in WTHF, CKONF and CKOHF compared to WTNF. Five metabolites belonged to retinol metabolism and linolenic acid metabolism showed same tendency increased most in CKOHF among 4 groups. The metabolites were tested with one-way ANOVA with Tukey’s HSD. *p<0.05, ****p<0.001. (B) This figure shows the quantified concentration of cholic acid, a representative composition of bile acid. Cholic acid showed the highest value in WTNF compared to the other groups.

