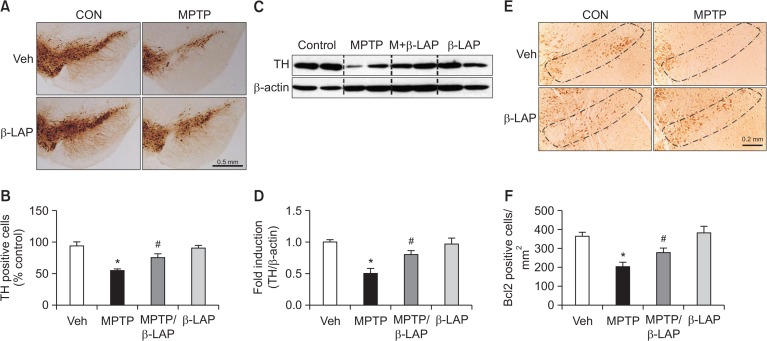
Fig. 2.
β-LAP recovered the TH and Bcl-2 positive cells in the SN of MPTP-treated mice. (A) Images of the immunostaining results showing TH expression in the SN (n=3 per brain and n=5 per group). (B) Quantification of TH-positive cells in the SNpc. (C) The protein extracts from the SN of each group were subjected to western blot analysis using TH antibodies (n=5 per group), and representative blots are provided. (D) Quantification of the western blot data. (E) Immunostaining images showing the Bcl-2 expression in the SNpc (n=3 per brain and n=5 per group). (F) Quantification of the Bcl-2 positive cells in the SNpc of the mice. *p<0.05 vs. the control group; #p<0.05 vs. the MPTP group.

