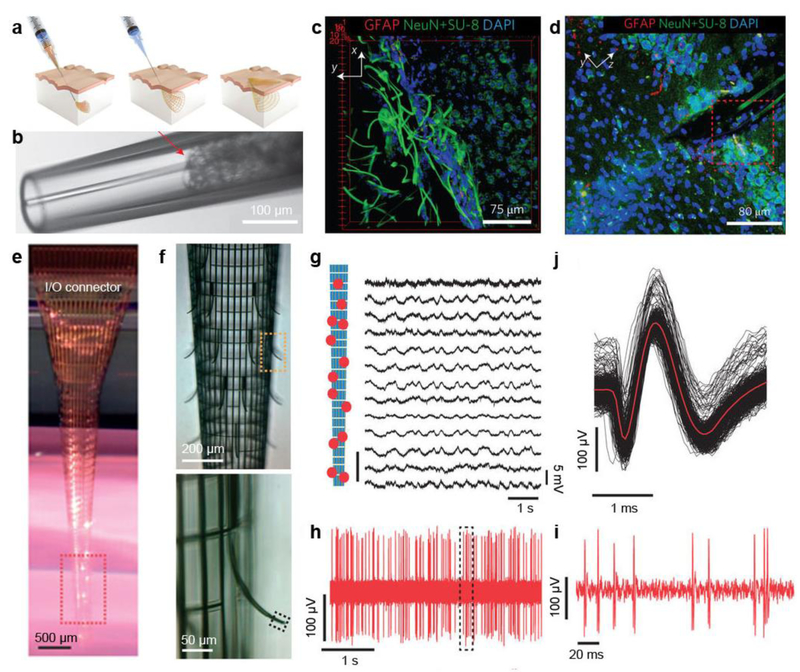
Figure 4. Minimally-invasive brain probes.
a, Schematics of injectable electronics. Red-orange lines highlight the overall mesh structure and indicate the regions of supporting and passivating polymer mesh layers. b, Images of mesh electronics injection through a glass needle (Inner diameter = 95 μm) into ×1 PBS solution: bright-field microscopy image of the mesh electronics immediately before injection into solution. c, 3D reconstructed confocal image at the interface between the mesh electronics and subventricular zone. d, Projection of the 3D reconstructed confocal image from a 30-μm thick, 317-μm-long and 317-μm-wide volume from a coronal slice of the hippocampal region five weeks post-injection of the mesh electronics. e, Photograph of a typical macroporous nanoelectronic brain probe suspended in buffer with a cylindrical shape. Its back end is attached to the carrier substrate (the dark piece in the back) at the top of the image. f, (Top) micrograph of the sensor area of the probe outlined by the red dashed box in (e); (Bottom) Zoomed-in view of the outward bent supporting arm and sensor outlined by the yellow dashed box in (f). g, Acute multiplexed local field potentials recording from 13 nanowire FET sensors following probe insertion into the somatosensory cortex. Relative positions of the 13 sensors are marked in the schematic on the left. h, Representative acute single-unit recording from Pt electrode sensors. i, Zoomed-in view of nine single-unit events outlined in (f). j, Superimposed 94 single-unit events from the recording in (h). Figure a-d are reproduced with permission from ref 37. Copyright 2015 Nature Publishing Group. Figure e-j are reproduced with permission from ref 38. Copyright 2015 Nature Publishing Group.

