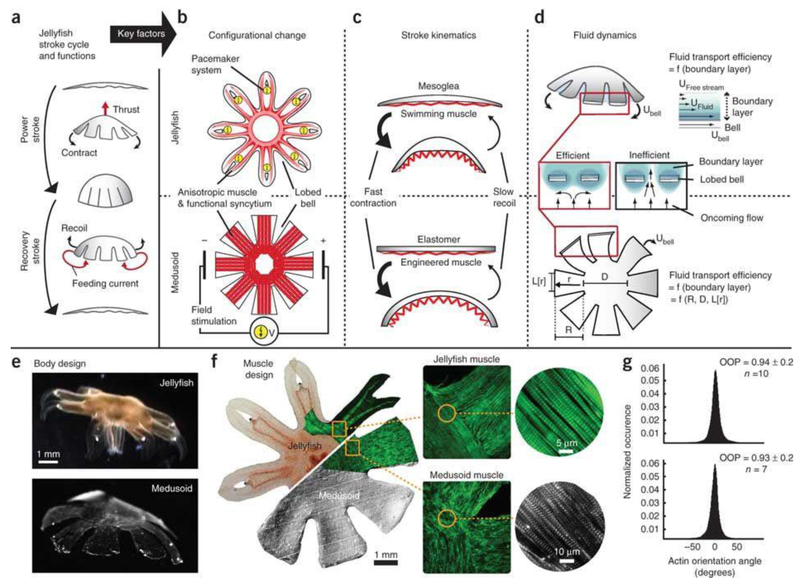
Figure 6. Artificial jellyfish.
a, Schematic diagram of jellyfish stroke cycle generating thrust during the power stroke, and feeding currents during the recovery stroke. b, Schematics showing the configurational change. c, Diagrams showing the stroke kinematics. In the bilayered design of jellyfish (top) and medusoid (bottom), a flexible elastomer opposes an actuator, which promotes asymmetric stroke patterns: active, fast contraction and passive, slow recoil. d, Illustration of the fluid dynamics. e, Design of jellyfish (top) and free-swimming medusoid construct (bottom). f, The 2D muscle architecture of a jellyfish (top) was reverse-engineered in medusoids (bottom). Left: Composite brightfield image overlaid with F-actin stain (green) of muscle cell monolayer. Square inset: Close-up on muscle organization at lobe-body junction; F-actin stain (green). Insets show the microstructure of single myofibril layer; F-actin stain (green), sarcomeric α-actinin (gray). g, Distribution of actin fiber orientation angles within single myofibril layer. Statistical analysis of multiple fields of view revealed no significant difference in the orientation organization parameter (OOP) (P = 0.61, n = 10; two-sample t-test). Figures are reproduced with permission from ref 55. Copyright 2012 Nature Publishing Group.

