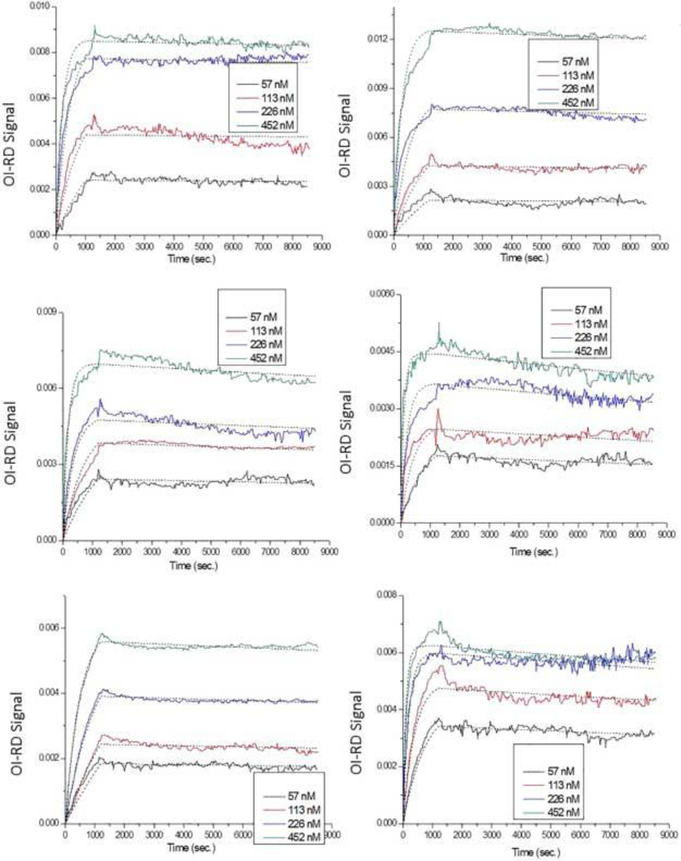
Figure 6.
Real-time binding curves and Langmuir one-to-one fittings of anti-2, 4-dinitrophenol reactions with surface (A) 40× 2, 4-dinitrophenol-bovine serum albumin, (B) 20× 2, 4-dinitrophenol-bovine serum albumin, (C) 10× 2, 4-dinitrophenol-bovine serum albumin, (D) 5× 2, 4-dinitrophenol-bovine serum albumin, (E) 1.5% 2, 4dinitrophenol-polyvinyl alcohol, and (F) 0.75% 2, 4-dinitrophenol-polyvinyl alcohol. Different colors represent different probe concentrations (black: 57 nM; red: 113 nM; blue: 226 nM; green: 452 nM), and dotted lines indicate fittings. All fitting parameters are listed in Table 5.

