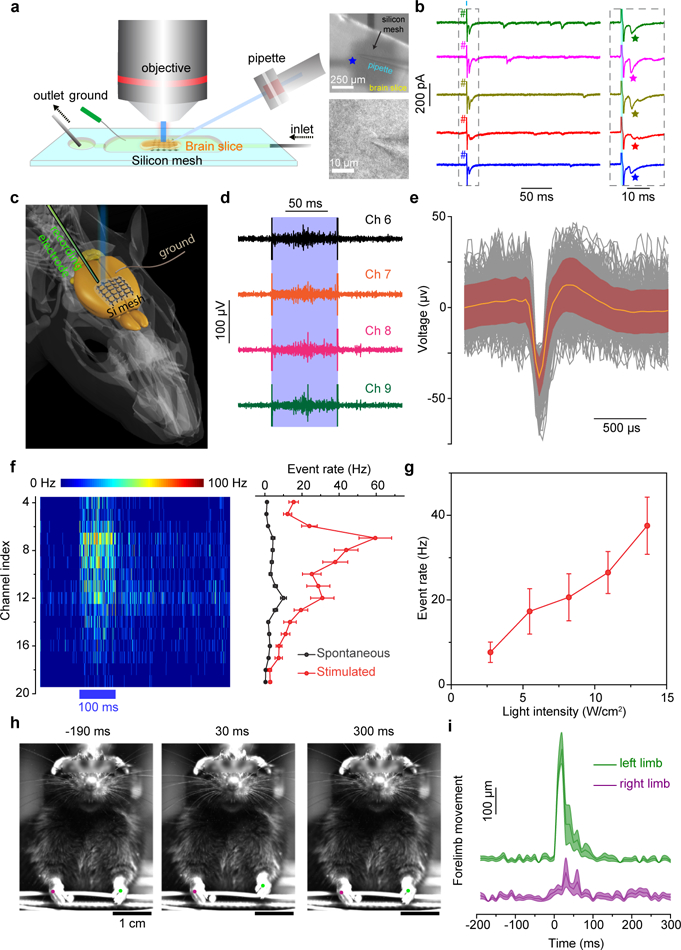
Figure 4 |. Flexible and distributed silicon mesh for optically-controlled extracellular neuromodulation.

a, A schematic diagram of a photostimulation of a brain slice performed in a perfusion chamber (left). A pyramidal neuron in a cortex slice was held at −70 mV in the whole-cell voltage-clamp mode (lower right) while a distributed Si mesh was placed underneath the slice (upper right). Short laser pulses (473 nm, 1 ms, ~ 2 mW, ~ 57 μm spot size) were delivered to a spot on the Si mesh (marked by a blue star) to activate the nearby cells. b, Example traces from voltage clamp recordings of the patched pyramidal neuron over 5 trials (left) with 1-ms long laser stimulations (cyan bar). The grey dashed box marks the time frame for zoom-in views on the right. EPSCs are marked by stars following the illuminations of the Si mesh (right). The cyan shaded area marks the illumination period in each trial. # denotes the photoelectric artifact. c, A schematic diagram illustrating the in vivo photostimulation test. A linear probe with 32 recording sites is guided into a head-fixed anesthetized mouse brain to sample the evoked neural activities by the illumination of an adjacent silicon mesh. d, Example traces of raw neural response data from four adjacent channels (Ch 6 to Ch 9) in a single trial of stimulation (473 nm, 100 ms, ~ 5 mW, ~216 μm spot size) marked by a light blue band. e, A mean neuron-firing waveform (orange) superposed on individual waveforms (black) of both spontaneous and stimulation-evoked activities. The maroon shaded area denotes standard deviations. Data are from 300 waveforms, with 153 from stimulated events and 147 from spontaneous events, in one representative photostimulation experiment on one mouse. f, A heat map of PSTH for channels between 4 and 19 (left) and the mean spontaneous and evoked neural response rates across all trials for the same channels in the PSTH heat map (right). The blue bar underneath the heat map indicates the period of laser stimulation. Error bars denote standard error of the mean (s.e.m.) of the data from 50 trials in one representative photostimulation experiment on one mouse. g, The evoked mean neural response rate is positively correlated with the stimulation laser intensity. Error bars represent s.e.m. from 50 trials in channel 9 in one representative photostimulation experiment on one mouse. h, Snapshots of a forelimb movement study following photostimulations. The mouse’s left limb (green dot) moves up and down following the laser illumination (473 nm, 50 ms, ~ 4 mW, ~ 216 μm spot size) on a Si mesh attached to the right side of the forelimb primary motor cortex. See Supplementary Video 1 for more details. i, Time-dependent mean limb movements show a preferred motion of the left forelimb after the stimulation. The 0 ms time point represents the start of the light pulse. Shaded areas denote s.e.m. of the data. Data are from 15 trials in one representative photostimulation experiment on one mouse.
