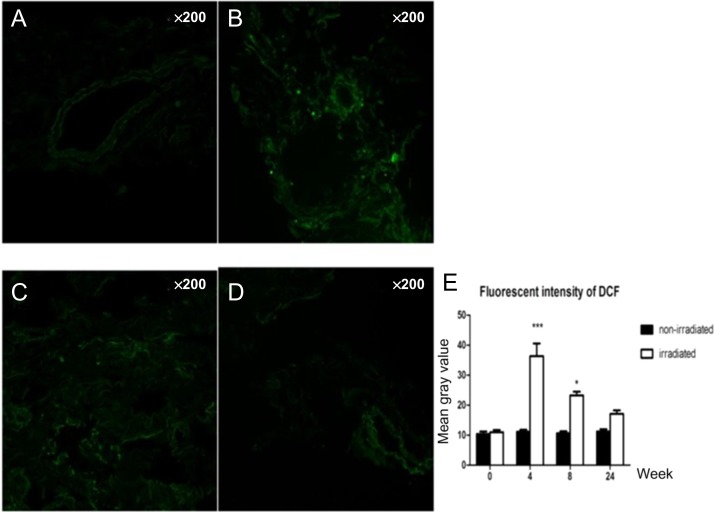
Fig. 2.
Dynamic changes in the amount of hydrogen peroxide and hydroxyl free radical: (A) only very small amounts of hydrogen peroxide and hydroxyl free radical showed in the control group; (B) 4 weeks after radiation; (C) 8 weeks after radiation; and (D) 24 weeks after radiation. (E) Compared with the control group, the irradiated samples showed dynamic changes, peaking at 4 weeks, then gradually decreasing over time. At 4 weeks and 8 weeks, the P values were both <0.05.

