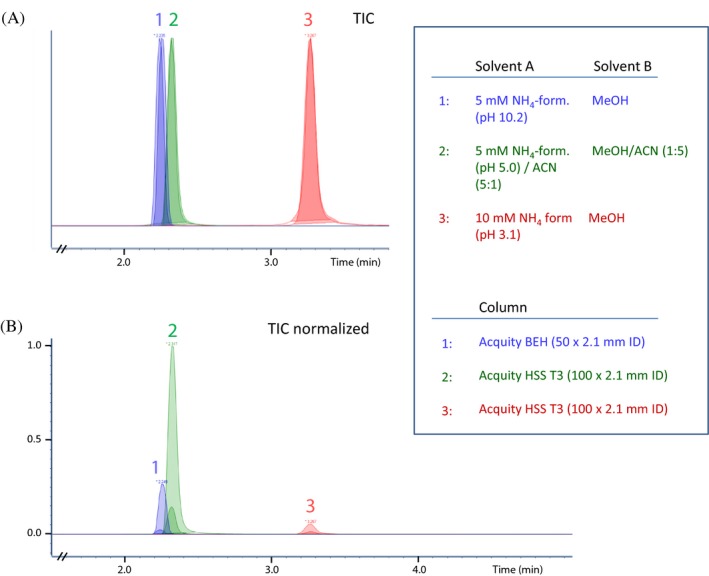
Figure 2.

Total ion chromatograms (TICs), not normalized (A), and normalized (B), obtained by UHPLC‐MS/MS analysis of standard samples containing PEth 16:0/18:1 and the internal standard. Gradient profile used was the same as for the validated method. Injection volume was 2 μL. Each of the three numbered sets contains two peaks (overlaid). The two peaks represent injections of two standard samples that had two different concentrations
