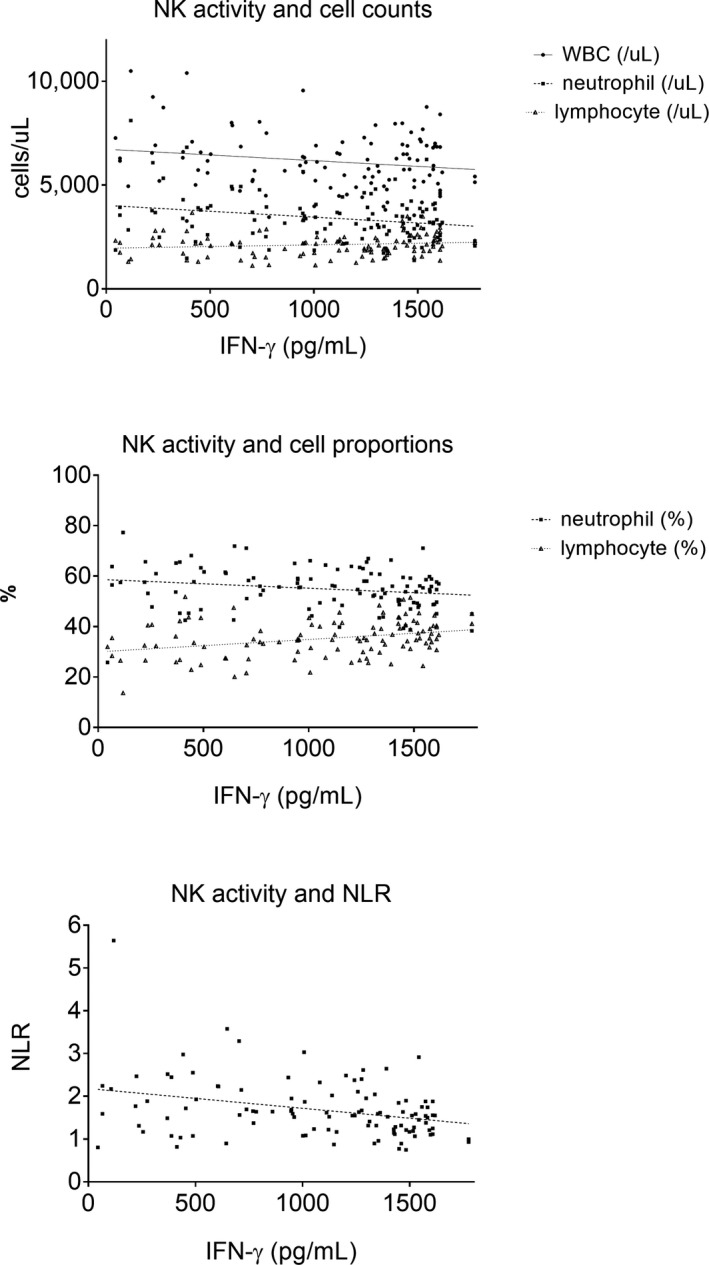
Figure 3.

Plots of regression analysis examining the relationships between IFN‐γ levels with WBC, neutrophil and lymphocyte counts (top), IFN‐γ levels with neutrophil and lymphocyte proportions (middle), and IFN‐γ levels with neutrophil‐to‐lymphocyte ratio (NLR). WBC and neutrophils count were negatively correlated with NK cell activity (top graph, P‐values 0.026, 0.028, respectively, and r‐values −0.214, −0.212, respectively). Lymphocyte proportion showed positive correlation with NK cell activity (P = 0.002, r = 0.298, middle graph). Neutrophil‐to‐lymphocyte ratio showed negative correlation with NK cell activity (P = 0.004, r = −0.320)
