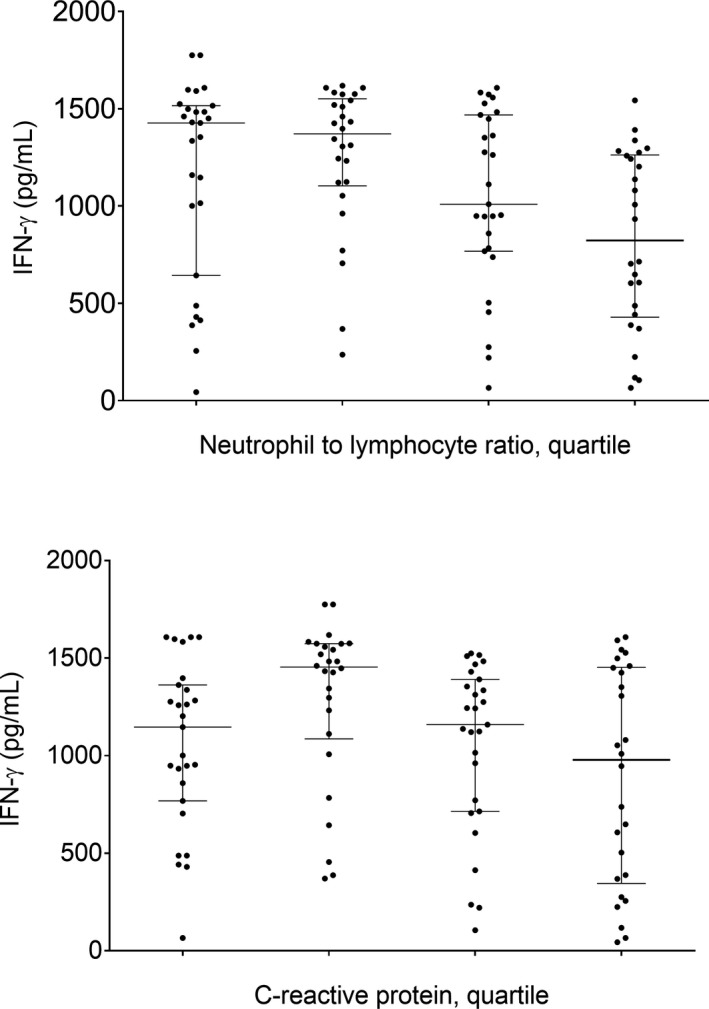
Figure 4.

Distribution of levels of NK cell activity in different neutrophil‐to‐lymphocyte ratio (NLR) quartiles and C‐reactive protein (CRP) levels. NK cell activity according to NLR quartile was statistically significant (P < 0.001, the values of each quartile are Q1: 0.75‐1.21, n = 27; Q2: 1.22‐1.56, n = 26; Q3: 1.58‐1.95, n = 27; Q4: 1.96‐5.64, n = 26, respectively). Horizontal lines indicate medians and 1st/3rd interquartile intervals (top graph). Increased CRP levels after the second quantile group was suggestive of decreased NK cell activity (bottom graph)
