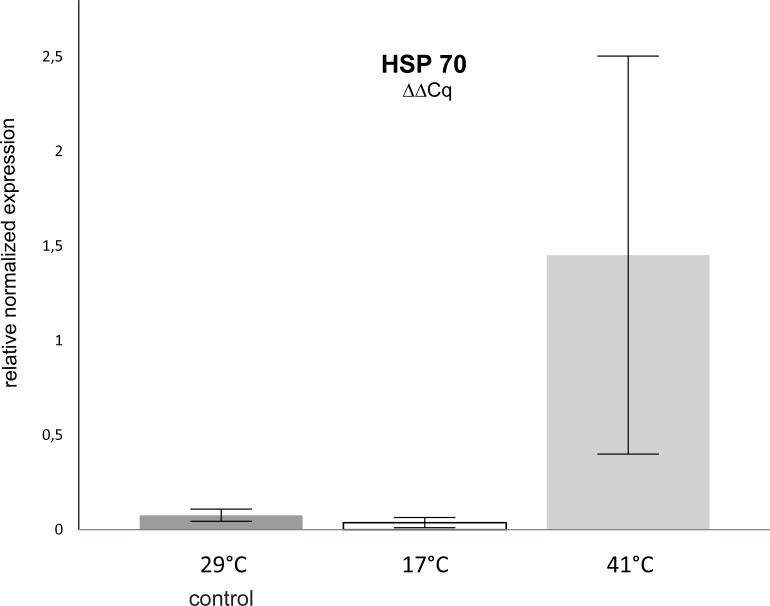
Fig 1. Average (mean ± standard deviation) relative normalized Hsp70 gene expression, for the two temperature manipulation experiments with eight biological replicates (n = 8), (1) cold (17°C; n = 8; p = 0.34) and (2) warm (41°C; n = 8; p = 0.00086) compared to the pooled controls (29°C; n = 16).
Differences between treatments were calculated using a Mann-Whitney test. Significant differences are indicated for P<0.05 (*) and P<0.01 (**).

