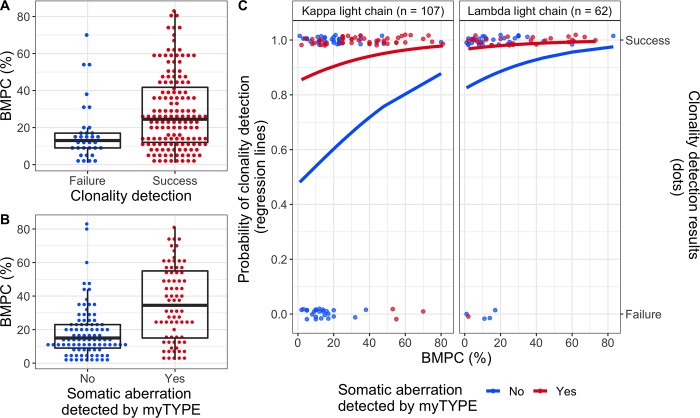
Fig 1. Predicting clonality detection.
A: Dot plot showing the percentage of bone marrow plasma cells in samples by success or failure of clonality detection. Median and quartile range are shown as a superimposed boxplot. B: Similar plot as in A, showing bone marrow plasma cells in samples where myTYPE was positive versus negative. C: Individual sample data and regression curves from a multivariate model to predict clonality detection. The right panel shows lambda light chain restricted multiple myeloma; the left panel shows kappa light chain multiple myeloma, including 1 patient whose tumor cells are negative for both kappa and lambda staining. Within each panel, regression lines shows the probability of clonality detection as a function of bone marrow plasma cell infiltration by aspirate smear within the myTYPE positive (red) and negative (blue) groups. Points plotted along the top panel border represent samples where clonality was detected, whereas no clonal V(D)J sequence could be found in the samples at the bottom. BMPC, plasma cells in bone marrow aspirate smear.

