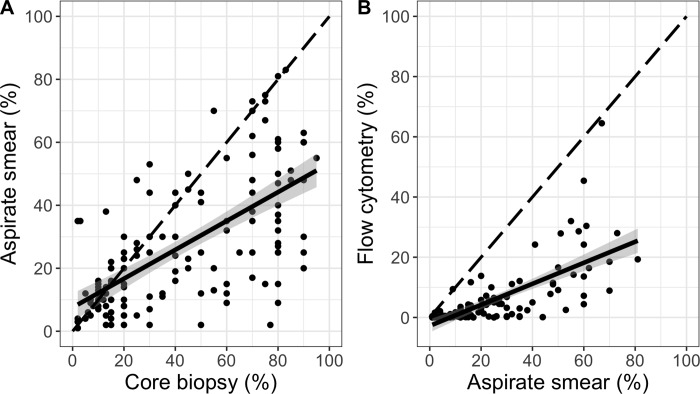
Fig 3. Progressively lower estimates of plasma cell content from core biopsy through aspirate smear and flow cytometry.
A: Dot plot of bone marrow plasma cell infiltration by aspirate smear versus core biopsy, with a fitted linear regression line (solid black) surrounded by its 95% confidence interval (n = 146; slope 0.46; 95% CI 0.37–0.55; R2 = 0.428; p<0.001). B: Similar plot as in A, showing aspirate smear and flow cytometry (n = 114; slope 0.35; 95% CI 0.28–0.42; R2 = 0.483; p<0.001). The diagonal dashed line shows where dots would have aligned if there was a 1:1 relationship between measurements.

