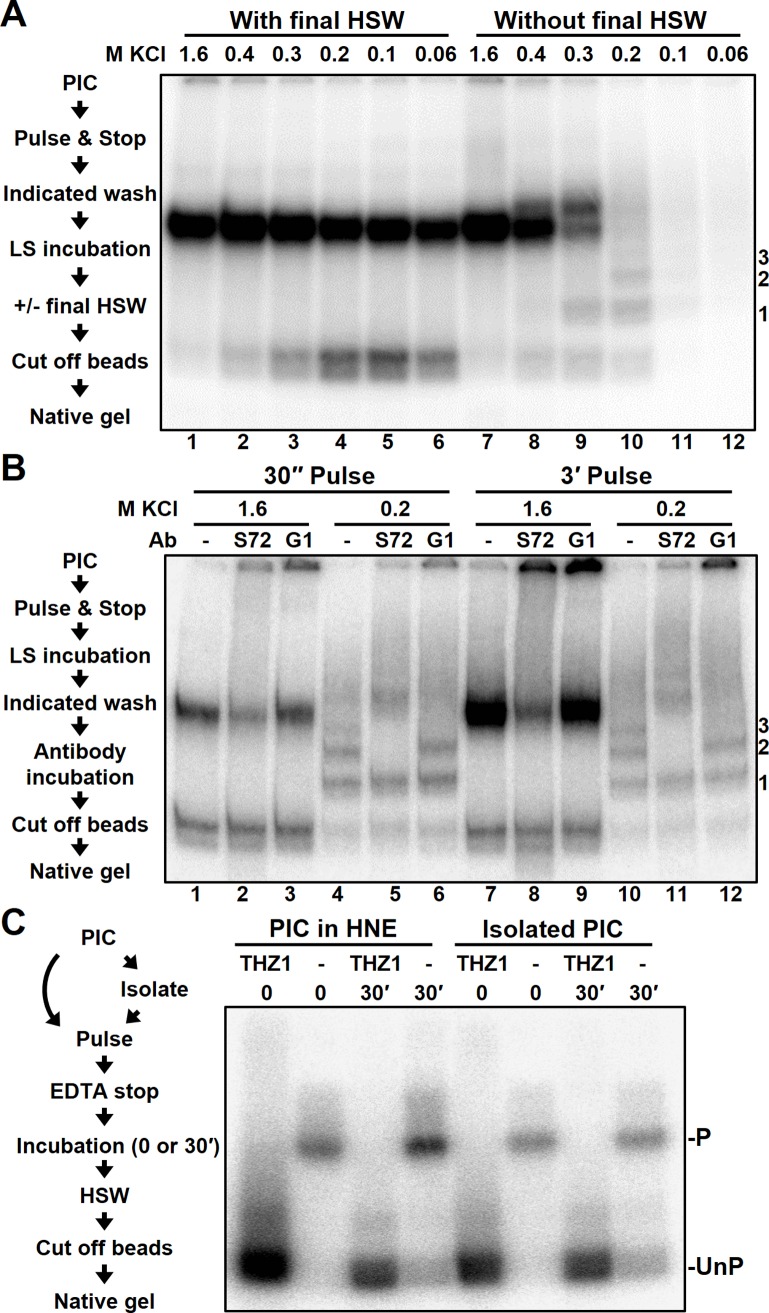
Fig 2. Association of the phosphatase activity with EECs & PICs.
A, diagram of steps performed to analyze salt-sensitivity of the phosphatase activity (left) and EC-EMSA of EECs incubated for 30 minutes after stopping a limiting UC pulse with EDTA, washing with the indicated KCl concentration washes, and washing first replicate with one final HSW prior to restriction (right). LSW and HSW are low (60 mM KCl) or high (1.6 M KCl) salt washes. Details are in Materials and Methods. Phosphatased bands with altered mobility are labeled 1, 2 and 3. B, diagram of steps performed to identify components of intermediate complexes (left) and EC-EMSA of complexes that were pulsed as indicated, stopped with EDTA, washed as indicated, and blotted with Ssu72 antibody (S72) and Gdown1 (G1) antibody after a 30’ low salt incubation. C, Diagram of steps performed to determine if the phosphatase associates with PICs (right) and EC-EMSA of EECs generated from PICs with and without THZ1 and HNE and incubated for indicated times.

